Figure 2
The importance of gestational age in first trimester, maternal urine MALDI-Tof MS screening tests for Down Syndrome
Ray K Iles*, Nicolaides K, Pais RJ, Zmuidinaite R, Keshavarz S, Poon LCY and Butler SA
Published: 31 December, 2019 | Volume 3 - Issue 1 | Pages: 010-017
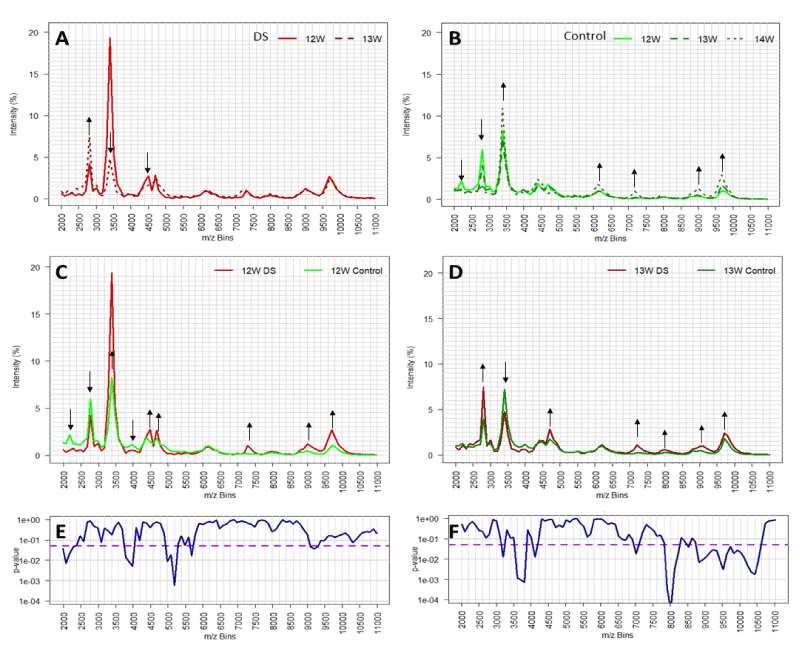
Figure 2:
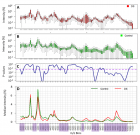
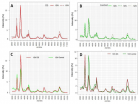
The effect of gestational age on mass spectral profiles of Downs maternal urine (DS, panel A) and non-aneuploid pregnancy urines (control, panel B). Comparison of urine mass spectral profiles (medians) between DS and control from pregnant with 12 and 13 weeks of gestation, panel C and D respectively. Mass bins with substantial changes in intensity are depicted through black arrows showing increase (up arrow) or decrease (down arrow). Statistical significance (p - values) of mass bins differences between DS and control population for 12 and 13 weeks of gestation are indicated in panels E and F, respectively. Threshold of significance (p - values < 0.05) are depicted in the purple dashed line.
Read Full Article HTML DOI: 10.29328/journal.apb.1001008 Cite this Article Read Full Article PDF
More Images
Similar Articles
-
The importance of gestational age in first trimester, maternal urine MALDI-Tof MS screening tests for Down SyndromeRay K Iles*,Nicolaides K,Pais RJ,Zmuidinaite R,Keshavarz S,Poon LCY,Butler SA. The importance of gestational age in first trimester, maternal urine MALDI-Tof MS screening tests for Down Syndrome. . 2019 doi: 10.29328/journal.apb.1001008; 3: 010-017
-
Detection of Transferrin Oxidative Modification In vitro and In vivo by Mass Spectrometry. Hereditary Hemochromatosis is a ModelMohamed Ahmed*. Detection of Transferrin Oxidative Modification In vitro and In vivo by Mass Spectrometry. Hereditary Hemochromatosis is a Model. . 2025 doi: 10.29328/journal.apb.1001025; 9: 009-019
Recently Viewed
-
Role of Perianesthesia Nurses in Enhanced Recovery After Surgery (ERAS) Protocols: A Narrative Review and Comparative Outcomes AnalysisOghogho Linda Akarogbe*,Geneva Igwama,Olachi Lovina Emenyonu,Idowu M Ariyibi. Role of Perianesthesia Nurses in Enhanced Recovery After Surgery (ERAS) Protocols: A Narrative Review and Comparative Outcomes Analysis. Int J Clin Anesth Res. 2025: doi: 10.29328/journal.ijcar.1001034; 9: 037-039
-
Climate Change and the Untold Story of EcoanxietyManar Zaki*. Climate Change and the Untold Story of Ecoanxiety. Insights Depress Anxiety. 2025: doi: 10.29328/journal.ida.1001044; 9: 012-016
-
Fiesta vs. Stress Condition the Incidence and the Age at Menarche. Forty Years of ResearchCarlos Y Valenzuela*. Fiesta vs. Stress Condition the Incidence and the Age at Menarche. Forty Years of Research. Clin J Obstet Gynecol. 2025: doi: 10.29328/journal.cjog.1001190; 8: 069-073
-
Minimising Carbon Footprint in Anaesthesia PracticeNisha Gandhi and Abinav Sarvesh SPS*. Minimising Carbon Footprint in Anaesthesia Practice. Int J Clin Anesth Res. 2024: doi: 10.29328/journal.ijcar.1001025; 8: 005-007
-
Identification, Molecular Confirmation, and Antibiotic Sensitivity of Bacteria Isolated from Repeat Breeder Cows in Rangpur DivisionMst. Mousumi Afroj,Md Faruk Islam,Muhammad Mamunur Roshid,Md Shanto Hossain,Md Samiul Tousif,Omiaya Azam Oishi,Subroto Sarma,Begum Fatema Zohara*. Identification, Molecular Confirmation, and Antibiotic Sensitivity of Bacteria Isolated from Repeat Breeder Cows in Rangpur Division. Insights Vet Sci. 2025: doi: 10.29328/journal.ivs.1001047; 9: 008-17
Most Viewed
-
Feasibility study of magnetic sensing for detecting single-neuron action potentialsDenis Tonini,Kai Wu,Renata Saha,Jian-Ping Wang*. Feasibility study of magnetic sensing for detecting single-neuron action potentials. Ann Biomed Sci Eng. 2022 doi: 10.29328/journal.abse.1001018; 6: 019-029
-
Evaluation of In vitro and Ex vivo Models for Studying the Effectiveness of Vaginal Drug Systems in Controlling Microbe Infections: A Systematic ReviewMohammad Hossein Karami*, Majid Abdouss*, Mandana Karami. Evaluation of In vitro and Ex vivo Models for Studying the Effectiveness of Vaginal Drug Systems in Controlling Microbe Infections: A Systematic Review. Clin J Obstet Gynecol. 2023 doi: 10.29328/journal.cjog.1001151; 6: 201-215
-
Causal Link between Human Blood Metabolites and Asthma: An Investigation Using Mendelian RandomizationYong-Qing Zhu, Xiao-Yan Meng, Jing-Hua Yang*. Causal Link between Human Blood Metabolites and Asthma: An Investigation Using Mendelian Randomization. Arch Asthma Allergy Immunol. 2023 doi: 10.29328/journal.aaai.1001032; 7: 012-022
-
Impact of Latex Sensitization on Asthma and Rhinitis Progression: A Study at Abidjan-Cocody University Hospital - Côte d’Ivoire (Progression of Asthma and Rhinitis related to Latex Sensitization)Dasse Sery Romuald*, KL Siransy, N Koffi, RO Yeboah, EK Nguessan, HA Adou, VP Goran-Kouacou, AU Assi, JY Seri, S Moussa, D Oura, CL Memel, H Koya, E Atoukoula. Impact of Latex Sensitization on Asthma and Rhinitis Progression: A Study at Abidjan-Cocody University Hospital - Côte d’Ivoire (Progression of Asthma and Rhinitis related to Latex Sensitization). Arch Asthma Allergy Immunol. 2024 doi: 10.29328/journal.aaai.1001035; 8: 007-012
-
An algorithm to safely manage oral food challenge in an office-based setting for children with multiple food allergiesNathalie Cottel,Aïcha Dieme,Véronique Orcel,Yannick Chantran,Mélisande Bourgoin-Heck,Jocelyne Just. An algorithm to safely manage oral food challenge in an office-based setting for children with multiple food allergies. Arch Asthma Allergy Immunol. 2021 doi: 10.29328/journal.aaai.1001027; 5: 030-037

If you are already a member of our network and need to keep track of any developments regarding a question you have already submitted, click "take me to my Query."


