Figure 2
Prediction of protein Post-Translational Modification sites: An overview
Md. Mehedi Hasan* and Mst. Shamima Khatun
Published: 02 March, 2018 | Volume 2 - Issue 1 | Pages: 049-057

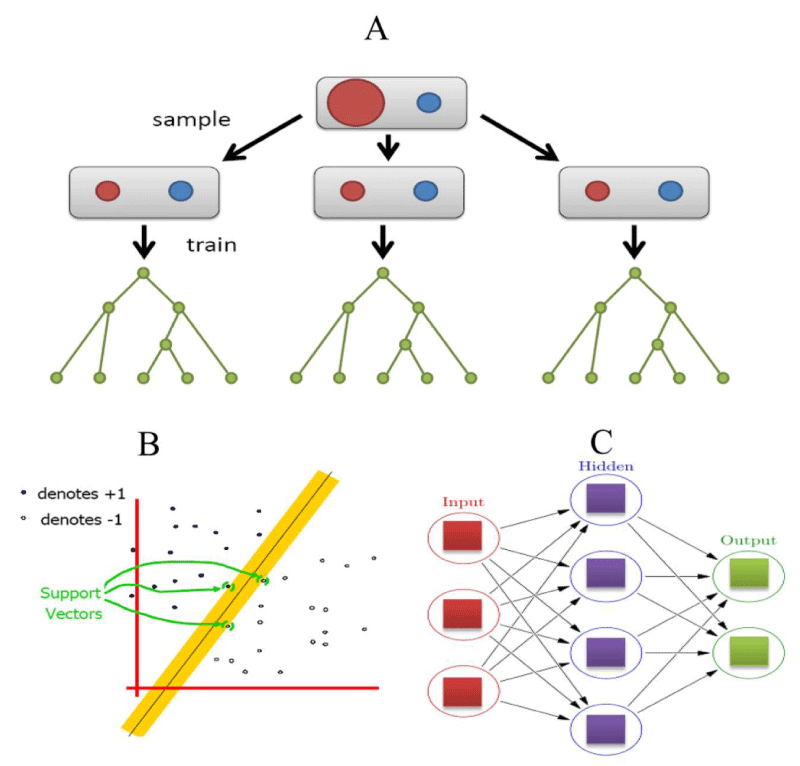
Figure 2:
Machine learning algorithms for PTMs prediction. (A) Random forest classifier. Here, red color denotes training samples, while green color denotes testing samples and each node represents a tree. (B) SVM classifier and (C) artificial neural network. Here, each circular node represents an artificial network, while an arrow represents a connection from the output of one network to the input of another.
Read Full Article HTML DOI: 10.29328/journal.apb.1001005 Cite this Article Read Full Article PDF
More Images
Similar Articles
-
Function Prediction of Proteins from their Sequences with BAR 3.0Giuseppe Profiti,Pier Luigi Martelli,Rita Casadio*. Function Prediction of Proteins from their Sequences with BAR 3.0. . 2017 doi: 10.29328/journal.hpbr.1001001; 1: 001-005
-
Microarray Analysis of Fish Genomic Data for enhancing Aquaculture Productivity of IndiaAjit Kumar Roy*. Microarray Analysis of Fish Genomic Data for enhancing Aquaculture Productivity of India. . 2017 doi: 10.29328/journal.hpbr.1001002; 1: 006-017
-
In silico analysis and characterization of fresh water fish ATPases and homology modellingRumpi Ghosh,AD Upadhayay,AK Roy*. In silico analysis and characterization of fresh water fish ATPases and homology modelling. . 2017 doi: 10.29328/journal.hpbr.1001003; 1: 018-024
-
The bio-energy transport in the protein molecules and its experimental validations of correctnessPang Xiao-Feng*. The bio-energy transport in the protein molecules and its experimental validations of correctness. . 2018 doi: 10.29328/journal.apb.1001004; 2: 001-048
-
Prediction of protein Post-Translational Modification sites: An overviewMd. Mehedi Hasan*,Mst. Shamima Khatun. Prediction of protein Post-Translational Modification sites: An overview. . 2018 doi: 10.29328/journal.apb.1001005; 2: 049-057
-
The properties of nonlinear excitations and verification of validity of theory of energy transport in the protein moleculesPang Xiao-Feng*. The properties of nonlinear excitations and verification of validity of theory of energy transport in the protein molecules. . 2018 doi: 10.29328/journal.apb.1001006; 2: 058-108
-
Theoretical study on binding interactions of laccase-enzyme from Ganoderma weberianum with multiples ligand substrates with environmental impactYosberto Cárdenas-Moreno*,Luis Ariel Espinosa,Julio Cesar Vieyto,Michael González-Durruthy,Alberto del Monte-Martinez,Gilda Guerra-Rivera,Maria Isabel Sánchez López. Theoretical study on binding interactions of laccase-enzyme from Ganoderma weberianum with multiples ligand substrates with environmental impact. . 2019 doi: 10.29328/journal.apb.1001007; 3: 001-009
-
The importance of gestational age in first trimester, maternal urine MALDI-Tof MS screening tests for Down SyndromeRay K Iles*,Nicolaides K,Pais RJ,Zmuidinaite R,Keshavarz S,Poon LCY,Butler SA. The importance of gestational age in first trimester, maternal urine MALDI-Tof MS screening tests for Down Syndrome. . 2019 doi: 10.29328/journal.apb.1001008; 3: 010-017
-
Classification of diseases using a hybrid fuzzy mutual information technique with binary bat algorithmFiras Ahmed Yonis AL-Taie*,Omar Saber Qasim . Classification of diseases using a hybrid fuzzy mutual information technique with binary bat algorithm. . 2021 doi: 10.29328/journal.apb.1001009; 4: 001-005
-
Improving cancer diseases classification using a hybrid filter and wrapper feature subset selectionNoor Muhammed Noori*,Omar Saber Qasim. Improving cancer diseases classification using a hybrid filter and wrapper feature subset selection. . 2020 doi: 10.29328/journal.apb.1001010; 4: 006-011
Recently Viewed
-
Gene Expression and Functional Analysis in Patients with Acute and Chronic Renal Allograft RejectionCarlos Carmona*, Marlon Castrillón, John Fredy Nieto, Gustavo Zuluaga, Luis Fernando Arias, Cristian Álvarez. Gene Expression and Functional Analysis in Patients with Acute and Chronic Renal Allograft Rejection. Ann Biomed Sci Eng. 2023: doi: 10.29328/journal.abse.1001025; 7: 051-063
-
Artificial awareness, as an innovative learning method and its application in science and technologyAdamski Adam*,Adamska Julia. Artificial awareness, as an innovative learning method and its application in science and technology. Ann Biomed Sci Eng. 2023: doi: 10.29328/journal.abse.1001020; 7: 012-019
-
Studies on some spices and herbs: Chemical composition, health benefits and functional propertiesHamdy A Shaaban*. Studies on some spices and herbs: Chemical composition, health benefits and functional properties. Ann Biomed Sci Eng. 2023: doi: 10.29328/journal.abse.1001019; 7: 001-011
-
Anesthetic Management of a Patient with Left Ventricular Thrombus Posted for Emergency LaparotomyArpita Das*. Anesthetic Management of a Patient with Left Ventricular Thrombus Posted for Emergency Laparotomy. Int J Clin Anesth Res. 2025: doi: 10.29328/journal.ijcar.1001028; 9: 013-016
-
An Update on Brachytherapy for Cervical Cancer: A ReviewArjun Moorthy,Ayan Issac,Ngoc-Anh Le,Kavin Mutyala*,Bhuvi Mamtani,Shyamal Patel,Lyndsay Willmott. An Update on Brachytherapy for Cervical Cancer: A Review. Clin J Obstet Gynecol. 2025: doi: 10.29328/journal.cjog.1001195; 8: 085-091
Most Viewed
-
Feasibility study of magnetic sensing for detecting single-neuron action potentialsDenis Tonini,Kai Wu,Renata Saha,Jian-Ping Wang*. Feasibility study of magnetic sensing for detecting single-neuron action potentials. Ann Biomed Sci Eng. 2022 doi: 10.29328/journal.abse.1001018; 6: 019-029
-
Evaluation of In vitro and Ex vivo Models for Studying the Effectiveness of Vaginal Drug Systems in Controlling Microbe Infections: A Systematic ReviewMohammad Hossein Karami*, Majid Abdouss*, Mandana Karami. Evaluation of In vitro and Ex vivo Models for Studying the Effectiveness of Vaginal Drug Systems in Controlling Microbe Infections: A Systematic Review. Clin J Obstet Gynecol. 2023 doi: 10.29328/journal.cjog.1001151; 6: 201-215
-
Causal Link between Human Blood Metabolites and Asthma: An Investigation Using Mendelian RandomizationYong-Qing Zhu, Xiao-Yan Meng, Jing-Hua Yang*. Causal Link between Human Blood Metabolites and Asthma: An Investigation Using Mendelian Randomization. Arch Asthma Allergy Immunol. 2023 doi: 10.29328/journal.aaai.1001032; 7: 012-022
-
An algorithm to safely manage oral food challenge in an office-based setting for children with multiple food allergiesNathalie Cottel,Aïcha Dieme,Véronique Orcel,Yannick Chantran,Mélisande Bourgoin-Heck,Jocelyne Just. An algorithm to safely manage oral food challenge in an office-based setting for children with multiple food allergies. Arch Asthma Allergy Immunol. 2021 doi: 10.29328/journal.aaai.1001027; 5: 030-037
-
Impact of Latex Sensitization on Asthma and Rhinitis Progression: A Study at Abidjan-Cocody University Hospital - Côte d’Ivoire (Progression of Asthma and Rhinitis related to Latex Sensitization)Dasse Sery Romuald*, KL Siransy, N Koffi, RO Yeboah, EK Nguessan, HA Adou, VP Goran-Kouacou, AU Assi, JY Seri, S Moussa, D Oura, CL Memel, H Koya, E Atoukoula. Impact of Latex Sensitization on Asthma and Rhinitis Progression: A Study at Abidjan-Cocody University Hospital - Côte d’Ivoire (Progression of Asthma and Rhinitis related to Latex Sensitization). Arch Asthma Allergy Immunol. 2024 doi: 10.29328/journal.aaai.1001035; 8: 007-012

If you are already a member of our network and need to keep track of any developments regarding a question you have already submitted, click "take me to my Query."


