
More Information
Submitted: May 21, 2025 | Approved: May 26, 2025 | Published: May 27, 2025
How to cite this article: Ahmed M, Detection of Transferrin Oxidative Modification In vitro and In vivo by Mass Spectrometry. Hereditary Hemochromatosis is a Model. Ann Proteom Bioinform. 2025; 9(1): 009-019. Available from:
https://dx.doi.org/10.29328/journal.apb.1001025
DOI: 10.29328/journal.apb.1001025
Copyright License: © 2025 Ahmed M, et al. This is an open access article distributed under the Creative Commons Attribution License, which permits unrestricted use, distribution, and reproduction in any medium, provided the original work is properly cited.
Keywords: Transferrin; Oxidative modifications; Mass spectrometry; Hereditary hemochromatosis
Abbreviations: HH: Hereditary Hemochromatosis; Met: Methionine; Trp: Tryptophan; His: Histidine; Trf: Transferrin; LC-MS/MS: Liquid Chromatography Tandem Mass Spectrometry

Detection of Transferrin Oxidative Modification In vitro and In vivo by Mass Spectrometry. Hereditary Hemochromatosis is a Model
Mohamed Ahmed*
Department of Basic Sciences, California Northstate University, College of Medicine, 9700 West Taron Drive, Elk Grove, CA 95758, USA
*Address for Correspondence:Mohamed Ahmed, MD, MSc, Assistant Professor of Anatomy and Embryology, California Northstate University, College of Medicine, Department of Basic Sciences, 9700 West Taron Drive, Elk Grove, CA 95758, USA, Email: [email protected]
Hereditary Hemochromatosis (HH) is an inherited recessive autosomal disorder characterized by the accumulation of excess iron. When iron-binding proteins become saturated, concentrations of free or Non-transferrin-bound iron (NTBI) rise, a condition thought to be responsible for the adverse effects associated with HH. To investigate whether disturbing iron homeostasis plays a role in free radical injury in HH, protein carbonyls were found to be 1-7 times higher in patients with HH than in controls, with the greatest increases observed in untreated HH patients with high ferritin and > 90% transferrin saturation with iron. An unpaired t-test revealed a p value of 0.0278 (p < 0.05), which is considered statistically significant.
In vitro oxidation of transferrin standards with hydrogen peroxide and excess iron, followed by immobilized trypsin digestion (Poroszyme), high-resolution LC-MS/MS analysis (Q-TOF Ultima, Waters), and MS/MS data processing (PEAKS, Bioinformatics Solution), identified several tryptic peptides containing oxidized Methionine (Met), Tryptophan (Trp), and Histidine (His) residues. Using the same methodology, oxidized residues were subsequently detected in transferrin isolated from plasma samples of patients severely affected by HH. Comparison of MS/MS spectra of In vitro oxidized samples with the most fragment ion peaks in common with oxidized peptide MS/MS spectra from patient samples revealed a strong correlation between the two. These data show that elevated NTBI may be involved in the oxidative modification of transferrin and that such modifications may play a significant role in the pathophysiology of HH.
Hereditary Hemochromatosis (HH) is an inherited disorder characterized by progressive iron deposition and tissue injury in multiple organs, secondary to an inherited predisposition to excessive and inappropriately regulated intestinal iron absorption. HH has been demonstrated to result from mutations in several genes involved in the regulation of iron homeostasis, such as HFE, TfR2, HJV, HAMP, and Ferroportin. The most common form of HH is associated with the homozygous p.C282Y mutation of the HFE gene. Although the prevalence of end-organ damage secondary to HFE-associated HH (HH-HFE) is relatively low, the p.C282Y mutation is highly prevalent, with a prevalence of 1:200 to 1:250 for p.C282Y homozygosity and 1:8 to 1:12 for p.C282Y heterozygosity among populations of northern European ancestry.
Transferrin (Trf) constitutes the major iron transport and/or scavenging system in vertebrates and some invertebrates. However, Trf can also function as an iron chelator, contributing to host defense by limiting iron availability for microbial pathogens. This capacity to bind iron enables transferrin to protect cells from oxidative damage. The hydroxyl radical (·OH) generated from superoxide (O2-) and hydrogen peroxide (H2O2) via the Haber-Weiss reaction has been suggested to be an important contributor to phagocyte-mediated tissue injury and other free radical-associated processes.
Trf is a soluble glycoprotein and a bilobal molecule, containing an N-terminal (amino acids 1-336) and a C-terminal (amino acids 337-679) globular domain. Each domain contains a metal-binding site, and each lobe binds one iron atom. Under normal conditions, these two high-affinity iron-binding sites prevent measurable amounts of unbound iron in the plasma. The main source of iron for transferrin is the catabolism of non-viable red blood cells, and its main destination is the erythroid marrow. Amino acid sequences of transferrins from several species, including human, bovine, rabbit, and chicken, show a high degree of sequence similarity.
Trf is one of the most important antioxidants, acting by sequestering iron in a redox-inactive form. Apotransferrin, at physiological concentrations (2-3 mg/ml), is known to inhibit lipid peroxidation in the liposome model by iron-binding. However, at higher concentrations, apotransferrin does not further inhibit lipid peroxidation, while at low concentrations, it reduces antioxidant capacity in a concentration-dependent manner. This finding is clinically relevant in diseases associated with lower plasma Trf concentrations due to either decreased synthesis or increased breakdown. Trf is a negative acute-phase protein that is downregulated in inflammatory diseases such as diabetes. Moreover, oxidative damage results in protein fragmentation and nephropathy, leading to Trf loss in the urine of type 1 and type 2 diabetic patients. Interestingly, microtransferrinuria appears to be a more sensitive index for renal dysfunction than microalbuminuria. Keenoy, et al. [1] reported that inhibition of lipid peroxidation by Trf was nearly complete in the presence of 60 μM iron, a concentration that saturates Trf completely (100% saturation).
Plasma Trf has considerable reserves for handling increasing amounts of incoming iron, but these may be exceeded in certain pathological diseases. In acute iron poisoning, Non-Trf-bound iron (NTBI) concentrations ranging from 128 μM to over 800 μM have been documented, exceeding the total iron-binding capacity of Trf. NTBI is weakly complexed to albumin, citrate, amino acids, and sugars, behaving differently from iron associated with Trf. Lehotay, et al. [2] indicated that patients with HH, but not other groups with iron overload status, exhibit higher-than-normal levels of NTBI compared to control groups without hemochromatosis.
In vitro oxidation of Trf (EDTA included)
Human serum Trf was purchased from Sigma and, in eight separate micro centrifuge tubes they were treated, according to the method of Rudek, et al. [3], with two different concentrations of 50 μL hydrogen peroxide (10 and 20 μM) in 250 μL of 20 mM phosphate buffer pH 7.2. The tubes were incubated in a water bath at 37 ºC. 500 µL of 10 mM EDTA (iron chelator) was added to each tube and the reaction tubes were transferred to ice. According to the method of Conrad, et al. [4] with some modifications, the reactants were removed by dialysis for 16 hours at 4 ºC against at least 125000 volumes of 20 mM Tris/150 mM NaCl, pH 6.8. The first cycle of dialysis contained 10 mM EDTA. The samples were then subjected to proteolytic digestion using trypsin, for subsequent protein identification or characterization.
Poroszyme™ method for protein digestion: Approximately 100 µL of sample was dried down on a speed vac at 35 ºC for ~ 1½ hrs. The dried sample was dissolved in 100 µL using 100mM ammonium bicarbonate buffer containing 60 mM dithiothreitol as a reducing agent. The mixture was heated for 1 hr at 45 ºC. Iodoacetamide was added in ammonium bicarbonate buffer to a final concentration of 190mM.The samples were heated for 1 hr at 37 ºC in dark.5 μL of Porozsyme beads (immobilized trypsin) were added to each sample and vortexed for 1 hr. The samples were centrifuged to pellet beads for 10 min at 10,000 g. The supernatant was transferred to a new tube without disturbing the beads. 10 μL were transferred to a smaller tube for solid-phase extraction using Millipore Zip Tips 10 μL 1% TFA in water was added to each. Using Millipore Zip Tip-C18 reversed phase (size P10) and a 10 μL pipette: Aspirate with 75% ACN with 0.1% TFA, dispense to waste 3 x 10 μL, Aspirate with 0.1% TFA in water, dispense to waste 3 x 10 μL. Samples were aspirated and dispensed in tubes 5 to 10 times. Tips were blown out. Tip was washed with 75% ACN with 0.1% TFA. Aspirate and dispense to waste 5x10 μL. Aspirate with α C matrix (5 mg/ml in 75% ACN with 0.1% TFA) to first indent on tip. Dispense onto plate target spot and mix, avoid forming bubbles on plate.
Protein identification by Q-TOF LC-MS/MS: The digest was evaporated to dryness, then dissolved in 12 µl of 1% aqueous TFA, of which 6 µL were analyzed by LC-MS/MS using a capLC ternary HPLC system (Waters, Milford, MA, USA) interfaced to a Q-TOF Ultima Global hybrid tandem mass spectrometer fitted with a Z-spray nanoelectrospray ion source (Micromass, Manchester, UK). Solvent A and C were comprised of 0.2% formic acid in water, while solvent B consisted of 0.2% formic acid in acetonitrile. The peptide digest sample was loaded onto a C18 trapping column (Symmetry 300, 0.35 x 5 mm Opti-pak; Waters) and washed for 3 min using solvent C at a flow rate of 30 μL/min. The flow path was then switched using a 10-port rotary valve, and the sample eluted onto a C18 analytical column (Pep Map, 75 μm x 15 cm, 3-μm particle size; LC Packings). Separations were conducted using a linear gradient of 5:95% to 60:40% B: A period of 43 min. The composition was then changed to 80:20% B: A and held for 10 min to flush the column before re-equilibrating for 7 min at 0:100% A: B. Mass calibration of the Q-TOF instrument was performed using a product ion spectrum of Glu-fibrinopeptide B acquired over the m/z range 50 to 1900. LC-MS/MS analysis was carried out using data dependent acquisition, during which peptide precursor ions were detected by scanning from m/z 400 to 1900 in TOF MS mode. Multiply charged (2+, 3+, or 4+) ions rising above predetermined threshold intensity levels were automatically selected for TOF-MS/MS analysis, by directing these ions into the collision cell where they were fragmented using low energy CID by collision with argon. Product ion spectra were acquired over the m/z range 50-900. LC-MS/MS data were processed using de novo sequencing software package PEAKS to assign as many high abundance peaks in the spectrum as possible.
In vitro excess iron overload and oxidation of Trf (EDTA is absent)
These experiments were conducted according to the methods of Chahine JM, et al. 1996, 1999 and Davies J. et al. 2003 [5-7], with some modifications: eight preparations were prepared by incubating 10 µL of serum Trf in 300 μL of 20 mM sodium bicarbonate for each. Four out of these preparations were allowed to interact with only one equivalent of FNAc3, the other four were allowed to interact with two equivalents of FNAc3. The reaction mix was incubated for 4 hours 37 ºC in a water bath. Half of the preparations were treated with 50 μL of 10 µM hydrogen peroxide; the other half was treated with 50 μL of 20 μM hydrogen peroxide. Half of the preparations were heated at 95 ºC for 7 minutes, followed by quick chilling on ice for denaturation. The other half was not heated. Reactants were removed by dialysis for 16 hours at 4 ºC against at least 125,000 volumes of 20 mM Tris/ 150 mM NaCl, pH 6.8. The samples were washed with ~ 250 µL of 100 μM ammonium bicarbonate after removal from the dialysis membranes. The proteins were digested into peptides and analyzed by Q-TOF LC-MS/MS using the same protocol described earlier.
In vivo detection of oxidative modification in plasma samples of patients of HH
We used the methods of Michielsen E, et al. [8] and Sisson T, et al. [9], a highly sensitive immunoprecipitation technique for extracting and concentrating proteins such as Trf in the plasma samples from patients with HH with a few modifications.
- The reactions were performed at room temperature.
- 100 mg of protein-G agarose (Sigma) was washed once with Phosphate-buffered Saline (PBS), pH 7.0 and then blocked with 250 μL of 1 g/L bovine serum albumin (BSA) (Sigma) in PBS for 60 min.
- Anti-Trf antibodies (Sigma), 2 μL of a concentration of 55 μg of the antibody which was mixed with PBS containing 1g/L BSA.
- Upon thorough mixing, the mixture was mixed with agarose beads and rotated for 1 h.
- After binding the antibodies, the beads were washed twice with excessive PBS.
- Antibodies were cross-linked to protein G-agarose by the addition of 200 mM triethanolamine (Pharmacia Biotech) in PBS to which 50 mM dimethyl pimelimidate (Sigma) was added directly before use (final pH 8.6) with rotation for 30 min.
- Cross-linking and washing were repeated twice to improve cross-linking efficiency.
- To each Eppendorf, 250 μL of plasma, 100 μL of 6 M urea and 150 μL PBST (PBS containing 0.2 mL/L Tween 20) and protein G-agarose beads were added, then rotated for 90 min and washed twice with PBST.
- Elution was performed by heating at 56 ºC for 20 min in 100 μL of 1 M glycine, pH 3.0.
- Samples were centrifuged, and supernatants were kept for analysis.
- Samples for electrophoresis were prepared by adding 20 μL of sample buffer (40 mM tris/HCl, 33 g/L SDS, 500 ml/L glycerol and Bromophenol Blue) to 50 μL of the eluate.
SDS-polyacrylamide gel electrophoresis (Linear Slab Gel): A rapid method was used for qualifying, comparing, and characterizing proteins, which separates proteins primarily based on their molecular weights, as described by Laemmli (1970). According to the manufacturer’s instructions (e.g., Rad Mini-Gel), the bottom of both the gel plate and spacer was perfectly flushed against a flat surface before tightening the clamp assembly to avoid leaks.
A 10% separating gel was prepared by adding 4.1 mL distilled water, 2.5 mL of 1.5 M Tris-HCl (pH 8.8), 3.3 mL of acrylamide/bis-acrylamide, 50 μL of 20% SDS, and 50 μL of 10% ammonium persulfate. 15 μL of TEMED was added right before pouring the separating gel solution onto the gel sandwich using a pipette. About 15 min were allowed for polymerization.
A 4% stacking gel was prepared using 3.075 mL distilled water, 1.25 mL of 0.5 M Tris-HCl (pH 6.8), 25 μL of 20% SDS, 0.67 mL of 30% acrylamide/bis-acrylamide, and 25 μL of 10% ammonium persulfate. 10 μL of TEMED was added right before pouring the stacking gel solution onto the gel sandwich. The stacking gel was added until it reached the top of the front plate. A comb was carefully inserted into the gel sandwich until the bottom of the teeth reached the top of the front plate. About 30 min were allowed for the stacking gel to polymerize, followed by careful removal of the comb.
Using a Hamilton syringe, 30 μL of the sample solution was introduced into the wells, avoiding air bubbles and leaving reasonable spaces among wells. Within the Mini-Protean electrophoresis chamber, the gel was placed, and a running buffer was added to the inner and outer reservoirs. A molecular mass standard was run in parallel. The gel was run at 120 V for approximately 40-50 min using a Power-Pac 300 power supply (Bio-Rad). After turning off the power, the electrodes, spacer, and gel plate were removed.
The gel was completely soaked in Coomassie Blue Stain for 10-20 min. About 50 mL of Coomassie destain was added overnight after pouring out the stain. The appropriate bands were excised the following day for digestion by proteolytic enzymes (Trypsin).
Trypsin digestion: For Coomassie de-stain, samples were treated with 50 μL of 100 μM ammonium bicarbonate and 50 μL acetonitrile, followed by a 10-min incubation at room temperature. 150 μL was aspirated from each well, and another 50 μL of ammonium bicarbonate and acetonitrile were added, followed by another 10-min incubation. 95 μL was aspirated from each well.
For dehydration, samples were treated with 50 μL acetonitrile and allowed to stand for 5 min. 45 μL was aspirated, followed by a 15-min incubation.
For reduction, 50 μL of 10 mM Dithiothreitol (DTT) was added and allowed to stand for 30 min.
For alkylation, 50 μL of 55 mM iodoacetamide was added and allowed to stand for 20 min. Another 100 μL acetonitrile was added and allowed to stand for 5 min. 195 μL was aspirated from each well.
For washing, 50 μL ammonium bicarbonate was added twice, followed by 10-min and 5-min incubation. 120 μL was aspirated.
For dehydration I, 50 μL acetonitrile was dispensed, followed by a 5-min wait. 45 μL was aspirated.
For dehydration II, 50 μL acetonitrile was added, followed by 5-min incubation. 75 μL was aspirated, followed by another 5-min incubation. Heater tiles were switched off and allowed to stand for 30 min.
For trypsin preparation, water and 100 mM ammonium bicarbonate were dispensed to each trypsin vial with mixed aspiration and dispensation. The final concentration of trypsin was 6 ng/μL.
Spectrophotometric assay for the detection of protein carbonyls in plasma samples of patients with HH: The methods used were based on Levine, et al. [10,11], Reznick, et al. [12], and Shacter [13]. The most convenient procedure to detect and quantify carbonyl content in protein preparation involves the reaction with 2,4-dinitrophenylhydrazine (DNPH), which reacts with protein carbonyls, forming a Schiff base that produces the corresponding hydrazone, analyzed spectrophotometrically at 370 nm.
Plasma sample preparation: A 5.0 mL blood sample was collected from each untreated HH patient and one normal individual as a control in heparinized tubes. Six patients who gave consent were recruited from HH patients attending the Department of Internal Medicine (Gastroenterology and Hepatology Division) at the Royal University Hospital in Saskatoon, Canada. Blood samples were centrifuged at 2000 × g for about 15 min to collect plasma, which was stored on ice until use or frozen at -20 ºC.
Procedure: 100 μL of each sample (including the control) was transferred to 2.0 mL plastic tubes. 400 μL of DNPH was added to sample tubes, while 400 μL of 2.5 M HCl was added to the control. All tubes were incubated in the dark at room temperature for one hour, with vortexing every 15 min. 0.5 mL of 20% TCA was added to each tube and incubated on ice for 5 min, followed by centrifugation at 10,000 × g for 10 min. The supernatants were discarded, and the pellets were resuspended in 0.5 mL of 10% TCA, incubated on ice, and centrifuged again. The pellets were washed using ethanol/ethyl acetate, thoroughly vortexed, and centrifuged. This step was repeated twice.
After the final wash, protein pellets were resuspended in 0.5 mL of guanidine HCl and heated for 15 min at 37 °C. Tubes were centrifuged at 10,000 × g to remove insoluble materials. A UV/Visible Spectrophotometer (Pharmacia Biotech) was used to obtain the spectrum by reading samples against 2.5 M HCl as a blank. Carbonyl content was measured at 370 nm using a molar absorption coefficient of 22,000 M⁻¹ cm⁻¹.
Determination of carbonyl content: The average absorbance of each sample and control was calculated. The average absorbance of the control was subtracted from the average absorbance of the samples to give the Corrected Absorbance (CA). The carbonyl concentration was determined using the equation:
Protein Carbonyl (nmol/ml) = (CA) / (22,000 M⁻¹ cm⁻¹) × (500 μL/200 μL).
Oxidized and unmodified peptides matching human transferrin
Data were acquired by Q-TOF LC-MS/MS analysis of immobilized trypsin digests of proteins oxidized in vitro.
Database searches were performed using PEAKS software and the following modifications:
- Oxidation of M, H, or W by a single oxygen atom (OxM, OxH, OxW)
- Oxidation of M, H, or W by two oxygen atoms (OOM, OOH, OOW)
- Oxidation of W to Kynurenine (KyW)
- Oxidation of W to 3-hydroxy Kynurenine (OHKyW)
Oxidized peptides that significantly match with human transferrin are highlighted in italics, may be used for targeted LC-MS/MS analysis in future experiments involving human plasma samples.
Transferrin (in the presence of H2O2 and EDTA): Table 1 shows a significantly high score of oxidized Met and Trp, 82.8% 99% and 72%, respectively as highlighted in italic. The m/z column indicates the mass to charge ratio, while the mr (calc) column indicates the corresponding total mass of the amino acid residues in the detected peptide. The start column indicates the first amino acid residue of the peptide matching while the end column indicates the last amino acid residue of the matching peptide.
| Table 1: Mass: 76981.6 score: 99.93% Coverage: 27.79% | ||||||
| Mz | Charge | Mr (calc) | Start | End | Score | Peptide |
| 489.7483 | 2 | 959.4712 | 216 | 225 | 56.3% | DGAGDVAFVK |
| 500.7794 | 2 | 981.4807 | 669 | 676 | 99% | YLGEEYVK |
| *606.3192 | 2 | 1192.5295 | 123 | 132 | 73.24% | DSGFQ(OxM)NQLR |
| 625.3531 | 2 | 1230.588 | 454 | 464 | 99% | SASDLTWDNLK |
| 642.2684 | 2 | 1264.5513 | 531 | 541 | 99% | EGYYGYTGAFR |
| 642.3628 | 2 | 1264.5513 | 531 | 541 | 94.8% | EGYYGYTGAFR |
| 659.0386 | 3 | 1955.9602 | 554 | 571 | 82.14% | HQTVPQNTGGKNPDPWAK |
| 746.4276 | 2 | 1472.7412 | 298 | 310 | 1.21% | SKEFQLFSSPHGK |
| 747.927 | 2 | 1475.7119 | 332 | 343 | 99% | (OxM)YLGYEYVTAIR |
| 762.4556 | 3 | 2267.152 | 143 | 162 | 3.47% | RSAG(OxW)NIPIGLLYCDLPEPR |
| 797.4498 | 2 | 1574.7915 | 476 | 489 | 92.85% | TAGWNIP(OxM)GLLYNK |
| 815.4871 | 2 | 1610.798 | 108 | 121 | 97.21% | EDPQTFYYAVAVVK |
| 937.9693 | 2 | 1855.8853 | 283 | 297 | 4.62% | (OOW)ELLNQAQEHFGKDK |
| 989.365 | 4 | 3934.9993 | 70 | 107 | 99% | AIAANEADAVTLDAGLVYDAYLAPNNLKPVVAEFYGSK |
As shown in Figure 1, the annotated MS/MS of m/z *606.3192 in vitro sample (Table 1). Strong y-type ions are shown (y1, y2, y4, y6, and y7) and x9. Both x and y-type ions retain the C-terminal residues. X-type ion is only formed predominantly in high-energy dissociation experiments at the C-terminal. Only one a-type ion (a2-type) is shown that retains the N-terminal residue. The abundance of y-type ions is typical of low-energy CID experiments.
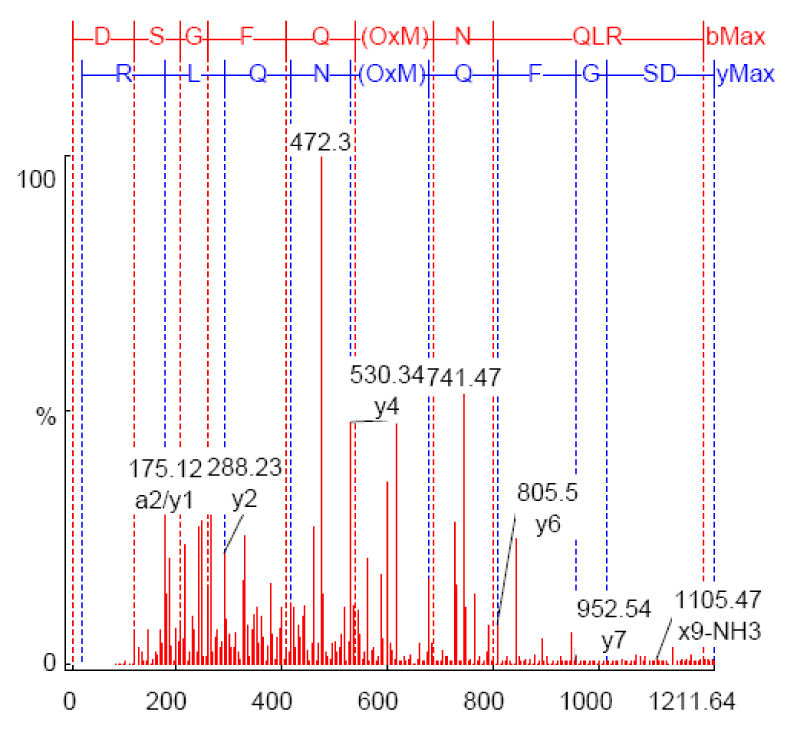
Figure 1: MS/MS spectrum of m/z 606.3192 from In vitro sample MOH070505_002 annotated by PEAKS after database matching against transferrin (Accession gi|31415705; 73.2% confidence).
Transferrin (in the presence of H2O2, excess iron and absence of EDTA)
Denatured transferrin: Table 2 shows a significant high score of oxidized Met (99%, 84.5%, 93.01% and 97.59% by single oxygen atom), Trp (93.41%, 93.01%, 98.33% by single oxygen atom and 99% by two oxygen atoms) His (87.58%, 91.42% and 81.6%) as highlighted in italic. The m/z column indicates the mass to charge ratio, while the mr (calc) column indicates the corresponding total mass of the amino acid residues in the detected peptide. The start column indicates the first amino acid residue of the peptide matching while the end column indicates the last amino acid residue of the matching peptide.
As shown in Figure 2, the annotated mass spectra of the mass*747.9921 (Table 2).
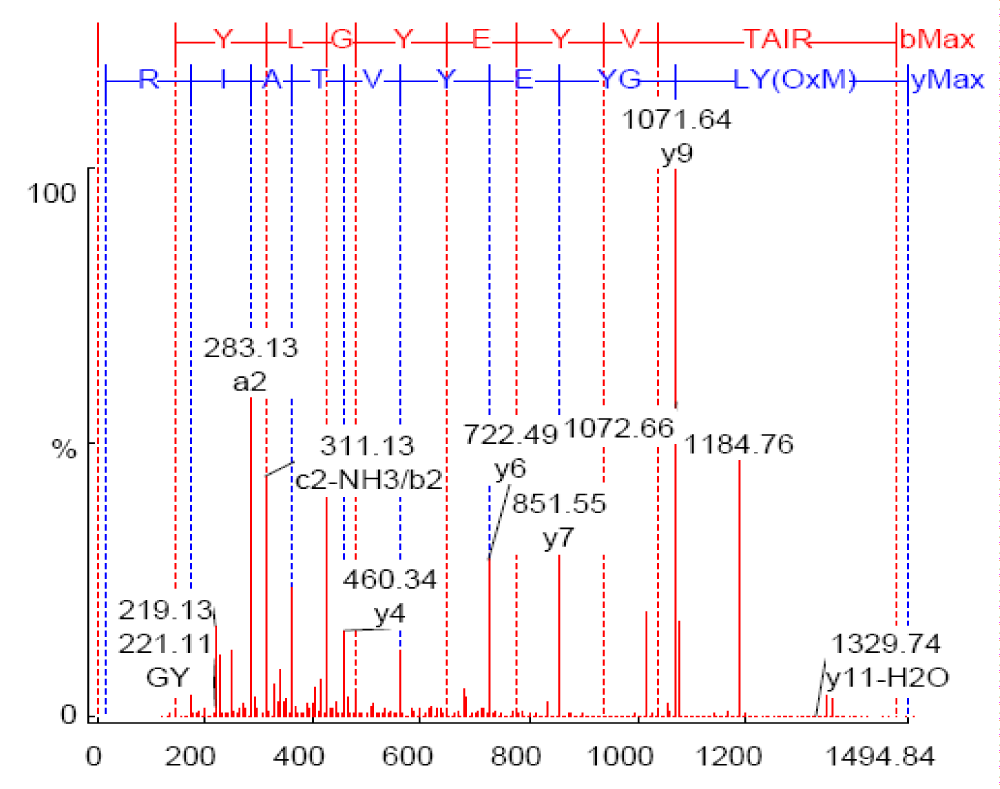
Figure 2: MS/MS spectrum of m/z 747.9921 from in vitro sample DT-3, annotated by PEAKS after database matching against transferrin (Accession gi|62897069; 99% confidence).
| Table 2: Mass: 77079.92 score: 99.88% Coverage: 36.39%. | ||||||
| Mz | Charge | Mr (calc) | Start | End | Score | Peptide |
| 453.7552 | 2 | 905.42426 | 316 | 323 | 87.58% | DSA(OOH)GFLK |
| 498.7909 | 2 | 995.51483 | 601 | 609 | 91.42% | APN(OOH)AVVTR |
| 526.9611 | 3 | 1577.8049 | 453 | 466 | 20.4% | KSASDLT(OxW)DNLKGK |
| 584.2852 | 2 | 1166.4961 | 38 | 46 | 14.11% | CQSFRDH(OxM)K |
| 633.3508 | 2 | 1264.5935 | 454 | 464 | 93.41% | SASDLT(OxW)DNLK |
| 641.3419 | 2 | 1280.5884 | 454 | 464 | 99% | SASDLT(OOW)DNLK |
| 642.3898 | 3 | 1923.9729 | 300 | 315 | 81.6% | EFQLFSSP(OOH)GKDLLFK |
| *747.9921 | 2 | 1493.7224 | 332 | 343 | 99% | (OxM)YLGYEYVTAIR |
| 797.3975 | 2 | 1592.802 | 476 | 489 | 84.5% | TAGWNIP(OxM)GLLYNK |
| 805.4689 | 2 | 1608.7969 | 476 | 489 | 93.01% | TAG(OxW)NIP(OxM)GLLYNK |
| 849.4998 | 3 | 2545.227 | 274 | 295 | 97.59% | S(OxM)GGKEDLIWELLNQAQEHFGK |
| 1043.6183 | 2 | 2085.0166 | 279 | 295 | 98.33% | EDLI(OxW)ELLNQAQEHFGK |
| 1051.6409 | 2 | 2101.0115 | 279 | 295 | 15.66% | EDLIWELLNQAQE(OOH)FGK |
| 1180.8079 | 4 | 4719.1577 | 344 | 384 | 7.74% | NLREGTCPEAPTDECKPVK(KyW)CALS(OOH)(OOH)ERLKCDEWSVNSVGK |
| 1318.8877 | 3 | 3953.9216 | 226 | 258 | 10.73% | (OxH)STIFENLANKADRDQYELLCLDNTRKPVDEYK |
Table 3 shows another set of oxidatively modified amino acid residues from another Denatured Human Serum Transferrin sample treated with H2O2 and excess iron in the absence of iron chelator (EDTA). A significant high score of Trp {99% and 99% by single and two oxygen atom(s), Met (98.02% and 83.57% by single oxygen atom) and His (53.05% by single oxygen atom) are shown.
As shown in Figure 3, the annotated mass spectra of the mass*633.4001 (Table 3).
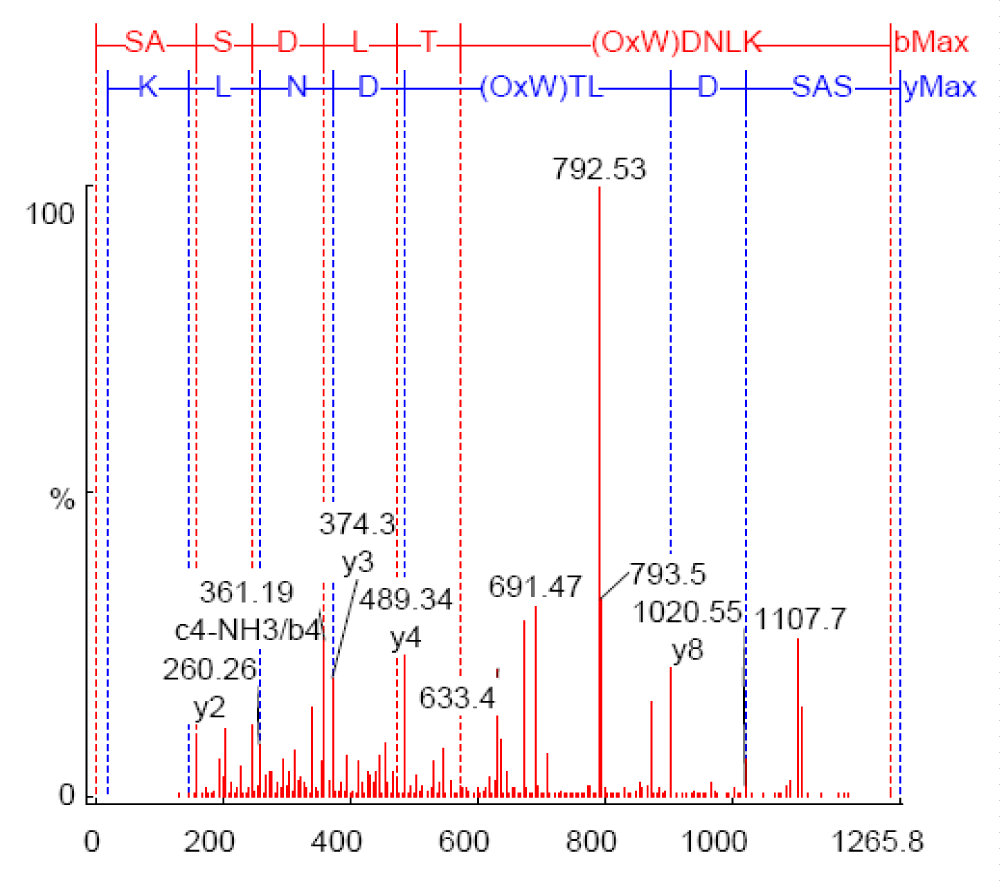
Figure 3: MS/MS spectrum of m/z 633.4001 from in vitro sample DT-4, annotated by PEAKS after database matching against transferrin (Accession gi|15021381; 99% confidence).
| Table 3: Mass: 77049.945 score: 99.08% Coverage: 28.65% | ||||||
| Mz | Charge | Mr (calc) | Start | End | Score | Peptide |
| 580.3556 | 2 | 1158.5928 | 133 | 143 | 5.32% | GKKSC(OxH)TGLGR |
| *633.4001 | 2 | 1264.5935 | 454 | 464 | 99% | SASDLT(OxW)DNLK |
| 641.3895 | 2 | 1280.5884 | 454 | 464 | 99% | SASDLT(OOW)DNLK |
| 642.4209 | 3 | 1923.9729 | 300 | 315 | 53.05% | EFQLFSSP(OOH)GKDLLFK |
| 747.9763 | 2 | 1493.7224 | 332 | 343 | 98.02% | (OxM)YLGYEYVTAIR |
| 797.4877 | 2 | 1592.802 | 476 | 489 | 83.57% | TAGWNIP(OxM)GLLYNK |
| 993.5349 | 4 | 3969.9165 | 226 | 258 | 4.89% | (OOH)STIFENLANKADRDQYELLCLDNTRKPVDEYK |
Native transferrin: Table 4 shows a significant high score of Met (84.37%, 99%, 65.29% by single oxygen atom and 50.2% by two oxygen atoms), His {99% and 96.02% by single and two oxygen atom (s) respectively}. No OxW residues were detected.
As shown in Figure 4, the annotated mass spectra of the mass *797.5536 (Table 4).
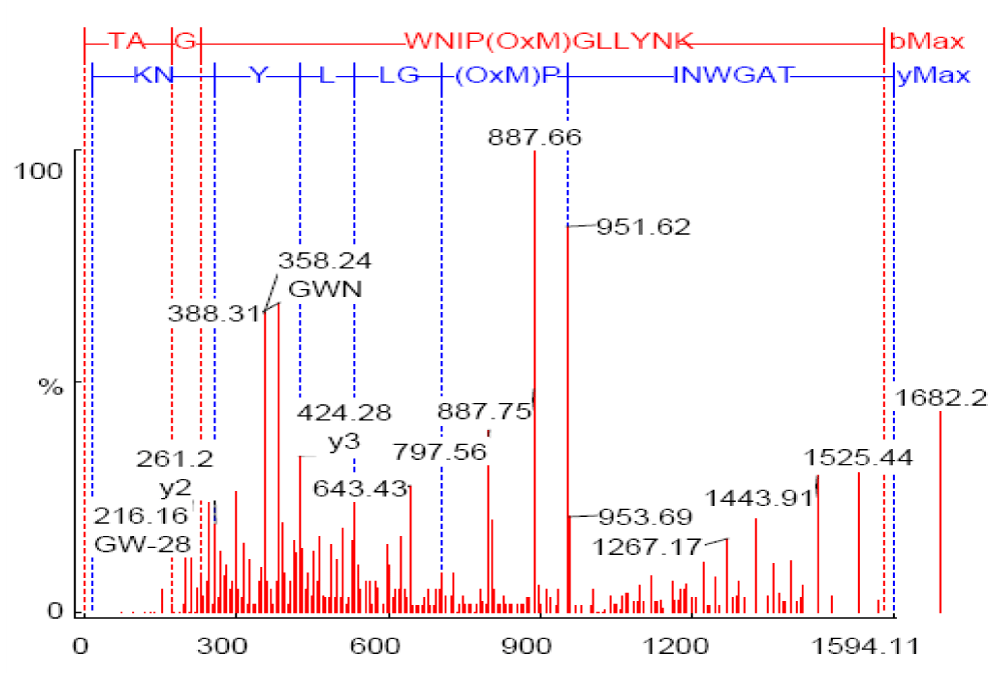
Figure 4: MS/MS spectrum of m/z 797.5536 from in vitro sample NT-4, annotated by PEAKS after database matching against transferrin (Accession gi|15021381; 65.3% confidence).
| Table 4: Mass: 77049.945 Score: 99.49% Coverage: 33.81% | ||||||
| Mz | Charge | Mr (calc) | Start | End | Score | Peptide |
| 467.3138 | 3 | 1398.6826 | 363 | 373 | 6.63% | (OHKyW)CALSHHERLK |
| 532.0272 | 3 | 1592.802 | 476 | 489 | 84.37% | TAGWNIP(OxM)GLLYNK |
| 591.8868 | 2 | 1181.5789 | 554 | 564 | 99% | (OxH)QTVPQNTGGK |
| 599.8873 | 2 | 1197.5737 | 554 | 564 | 96.02% | (OOH)QTVPQNTGGK |
| 748.0038 | 2 | 1493.7224 | 332 | 343 | 99% | (OxM)YLGYEYVTAIR |
| 797.4687 | 2 | 1592.802 | 476 | 489 | 49.71% | TAG(OxW)NIPMGLLYNK |
| *797.5536 | 2 | 1592.802 | 476 | 489 | 65.29% | TAGWNIP(OxM)GLLYNK |
| 805.5341 | 2 | 1608.7971 | 476 | 489 | 50.2% | TAGWNIP(OOM)GLLYNK |
| 1092.7343 | 4 | 4367.154 | 572 | 609 | 7.13% | NLNEKDYELLCLDGTRKPVEEYANCHLARAPN(OxH)AVVTR |
| 1211.1198 | 2 | 2420.1729 | 468 | 489 | 7.43% | SC(OxH)TAVGRTAG(OxW)NIPMGLLYNK |
| 1310.8466 | 4 | 5239.5205 | 565 | 609 | 10.48% | NPDP(OOW)AKNLNEKDYELLCLDGTRKPVEEYANC(OOH)LARAPN(OxH)AVVTR |
| 1318.8839 | 3 | 3953.9216 | 226 | 258 | 8.05% | (OxH)STIFENLANKADRDQYELLCLDNTRKPVDEYK |
1-D SDS-PAGE for plasma samples of patients of HH: Immunoprecipitants of plasma samples from patients with HH were run on SDS-PAGE. A molecular weight marker (MWT) was run in parallel with the plasma samples, shown at right in Figure 5. This figure also shows the transferrin bands for the samples P4A, P2 and P2A from right to left, respectively. Transferrin bands were visualized by Commassie stain at the molecular mass of 78 kDa. The appropriately sized bands were then excised from the gel, destained and digested with a proteolytic enzyme (trypsin) to generate discrete peptide fragments for which molecular masses were determined.
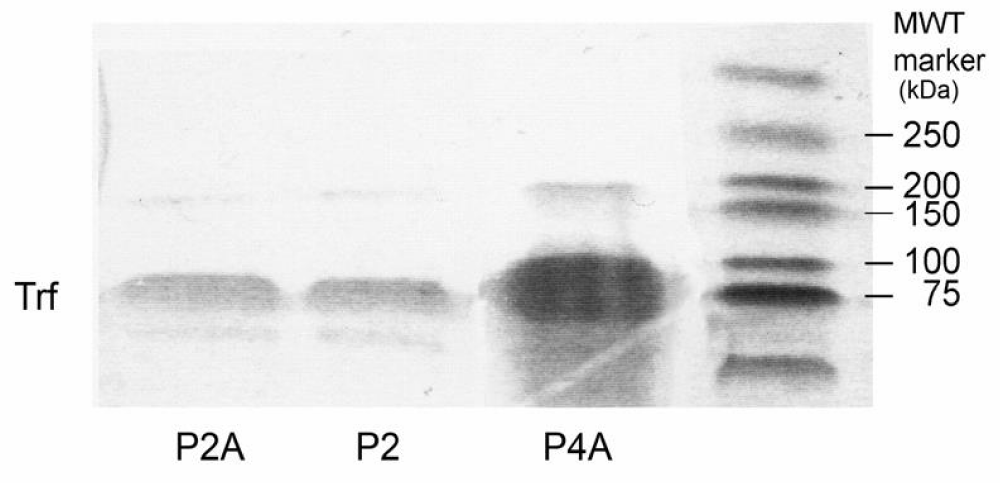
Figure 5: 1-D SDS-PAGE shows transferrin bands (Trf), visualized by Coomassie stain at the molecular mass of 78 kDa from immunoprecipitants of plasma samples from patients with HH. The protein was loaded onto a 10% gel, stained by Coomassie, destained and digested into peptide fragments by trypsin.
Summary of PEAKS database search results using data from targeted LC-MS/MS analysis of in previous in vitro experiments of oxidized peptides
Trf was detected either through matching of target oxidized peptides identified during the in vitro experiments or matching of unmodified peptides whose m/z values were sufficiently close to those of the target oxidized peptides to be selected for MS/MS. Results for samples P2, P2A, P4A and showed transferrin as the top hit. Taking sample P2 as an example revealed the following:
Table 5 shows m/z, charges, and scores of different modified and unmodified peptides of Protein digest of plasma Sample P2 of a patient with HH.
| Table 5: Mass: 63407.215 score: 27.27% Coverage: 14.19%. | ||||||
| Mz | Charge | Mr (calc) | Start | End | Score | Peptide |
| 403.1744 | 3 | 1206.563 | 533 | 541 | 18.23% | L(OOH)DRNTYEK |
| 544.9492 | 3 | 1631.8201 | 132 | 146 | 40.08% | DCHLAQVPSHTVVAR |
| 633.15735 | 2 | 1264.5935 | 327 | 337 | 7.83% | SASDLT(OxW)DNLK |
| 762.3158 | 2 | 1522.7415 | 171 | 183 | 4.57% | SKEFQLFSSP(OOH)GK |
| 796.78906 | 2 | 1591.7156 | 389 | 403 | 2.83% | LCMGSGLNLCEPNNK |
| 797.5013 | 2 | 1592.802 | 349 | 362 | 83.19% | TAGWNIP(OxM)GLLYNK |
| 853.9678 | 2 | 1705.8999 | 326 | 340 | 2.45% | KSASDLT(OxW)DNLKGKK |
MS/MS analysis of the oxidatively modified peptide, SASDLT(OxW)DNLK (m/z 633.15735) shows a score of 7.83% for OxW with a single O atom. In addition, the analysis of the same sample for the oxidatively modified peptide, KSASDLT(OxW) DNLKGKK (m/z 853.9678) revealed a score of 2.45% with a single O atom. MS/MS analysis of the same plasma sample for oxidatively modified peptide, TAGWNIP(OxM)GLLYNK, (m/z 797.5013) shows a significant score of 83.19% for OxM with a single O atom (Figure 5).
MS/MS analysis of the oxidatively modified peptides, L(OOH)DRNTYEK (m/z 403.1744) and SKEFQLFSSP(OOH)GK (m/z 762.3158) show scores of 18.23% and 4.57% for OOH with two O atoms.
Figure 6 shows the annotated MS/MS spectra of m/z (633.17535) from the In vivo sample, in which two y-type ions are shown (y2, y3). Y-type ions retain the C-terminal residues. Two z80-type ions (z2, z5-type) are also shown, which retain the C-terminal residue as well. However, z-type ions are weakly represented in this figure due to the fact that they only show abundance in high-energy CID experiments. D(OxW)TLDSAS and LT(OxW)DNLK represent the theoretical partial sequences developed from the C-terminal (y-type) and N-terminal (b-type), respectively.
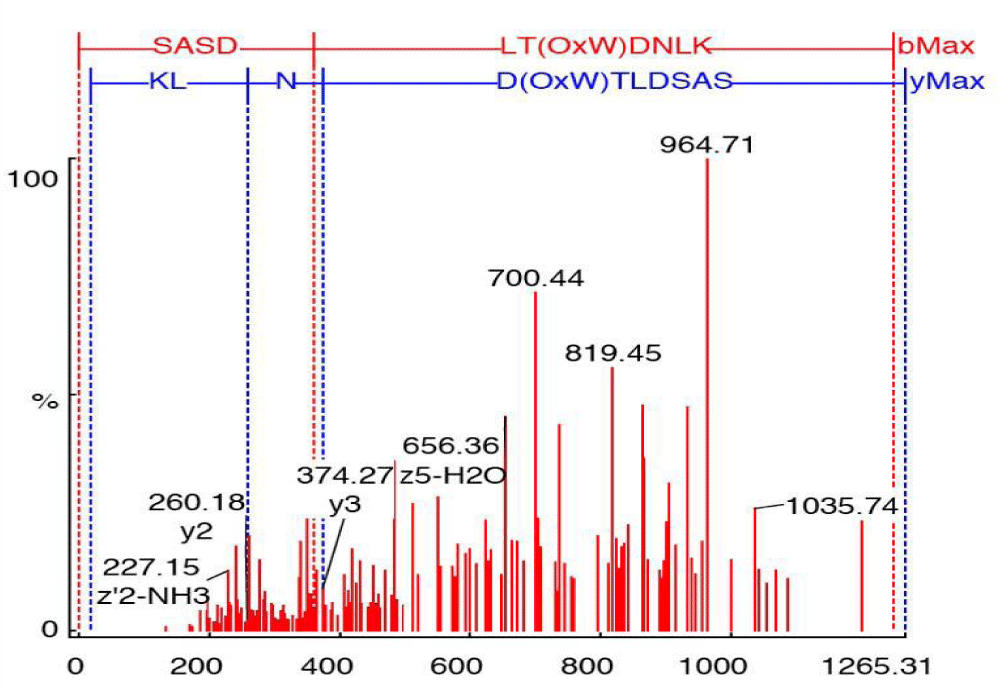
Figure 6: Annotated MS/MS spectrum for the peptide SASDLT(OxW)DNLK, m/z 633.17535, showing singly charged y-type ion. b-type ions are not annotated.
Detection of protein carbonyls in plasma samples of patients with HH
Compared to the controls, HH patients’ plasma samples recorded a significantly high content of protein carbonyls (1-7 times), which correlated with the relative levels of serum ferritin and Trf saturation regardless of whether the patients were homozygous or heterozygous to C282Y or H63D. Sample 2 recorded the highest carbonyl content among all (80.3 ± 44.8 pmol/μL). This sample was from a patient with active hepatitis due to HCV infection, as well as high serum ferritin, 1517 ng/L (normal: 20–250 ng/L) and high serum transferrin saturation, 93% (normal: 17 – 50%) (Table 6). The genotypic testing of this patient revealed one copy of H63D. The lowest carbonyl content was from a patient with serum ferritin of 182 ng/L and serum transferrin saturation of 54%. This patient reported a carbonyl content of 15.0 ± 20.5 pmol/μL. The genotypic testing of this patient revealed two copies of C282Y (Table 3, Page 50). The average from our controls (n = 6) recorded a carbonyl content of 10.03 ± 4.2 pmol/μL plotted against the average from patients with HH (n = 6) which had a carbonyl content of 35.5 ± 23.9 pmol/μL (Figure 7). These findings correlated well with those of Houglum, et al. [14]. They tested 15 subjects for each group of control, as well as untreated and treated patients with genetic hemochromatosis. According to Houglum, et al. genetic hemochromatosis patients had increased transferrin saturation and serum ferritin levels prior to treatment compared to control and treated patients. Their data and ours showed a significant positive correlation between the level of carbonyl content and serum ferritin concentration, which shows a positive correlation between ferritin content and carbonyl content of plasma samples from controls and patients with HH.
| Table 6: Comparison of Control and HH patients. | |||||||
| Parameter | Control | Patient 1 | Patient 2 | Patient 3 | Patient 4 | Patient 5 | Patient 6 |
| Age (y) | 44 | 49 | 41 | 41 | 40 | 63 | 56 |
| Sex | M | F | M | M | M | M | F |
| Serum ferritin (ng/ml) (N: 20-250) | 55 | 182 | 1517 | 195 | 767 | 870 | 310 |
| Serum transferrin saturation (%) (N: 17-50) | 22 | 54 | 93 | ND* | 82 | 76 | 78 |
| Serum iron (µM/L) (N: 11.6-31.3) | ND* | 25 | 52 | ND* | 36 | 39 | ND* |
| AST (U/L) (N: 8-20) | 10 | 24 | 114 | 49 | 22 | 38 | ND* |
| ALT (U/L) (N: 8-20) | 12 | 30 | 158 | 59 | 36 | 51 | ND* |
| ND*: Not Determined, Sex*: Males are Predominant. | |||||||
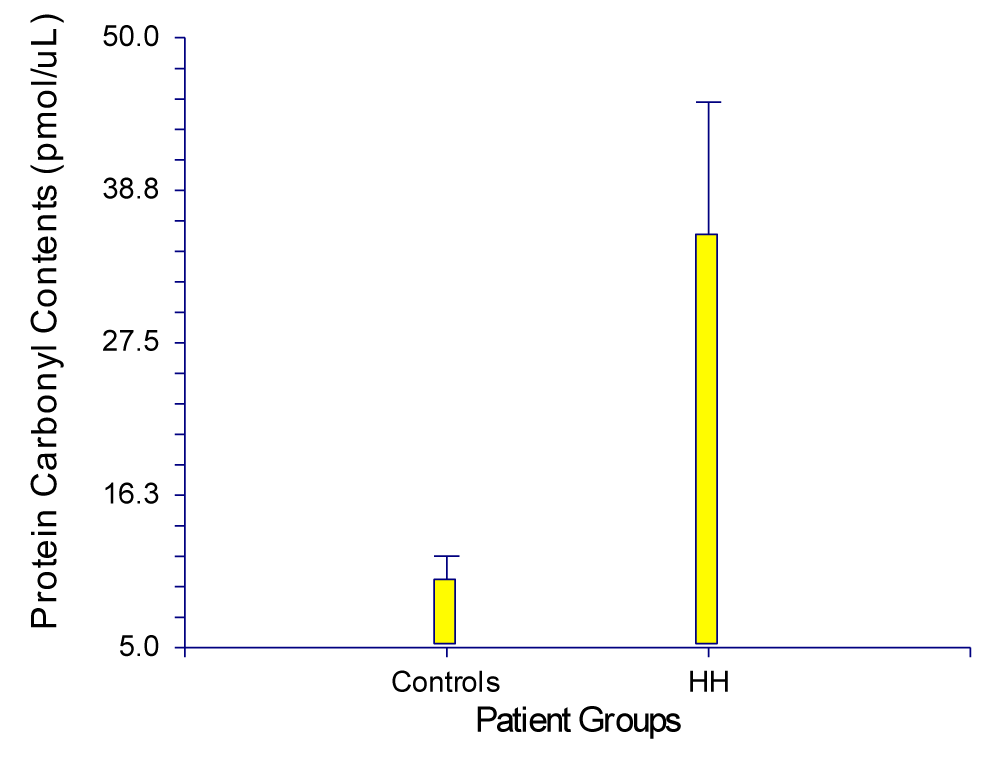
Figure 7: Standard Error bar Graph of Controls and HH Patient Means.
Statistical analysis
Unpaired t-test results: p value and statistical significance: The two-tailed p value equals 0.0278 (p < 0.05); by conventional criteria, this difference is statistically significant.
Confidence interval: The mean of Controls minus HH Patients equals -25.4700
95% confidence interval of this difference: From -47.5434 to -3.3966
Intermediate values used in calculations: (Table 7).
| Table 7: t = 2.5710; df = 10; Standard error of difference = 9.907. | ||
| Group | Controls | HH Patients |
| Mean | 10.0300 | 35.5000 |
| SD | 4.2000 | 23.9000 |
| SEM | 1.7146 | 9.7571 |
| N | 6 | 6 |
The detection of the oxidative modification of proteins has been used as a marker of oxidative stress. Oxidative stress can occur when reactive oxygen species (ROS) production is accelerated or when the mechanisms involved in maintaining the normal reductive cellular milieu are impaired (either by depletion of antioxidants or mutations affecting antioxidant defense enzymes such as Cu / Zn-SOD). Increased production of ROS is thought to occur more frequently than diminished antioxidant defense [15]. It should be emphasized that the detection of more than one marker for oxidative stress is strongly recommended to avoid the misleading results that might be given by depending on only one marker. In our experiments, we detected more than one marker to confirm oxidative injury that may lead to disturbance of iron homeostasis in untreated patients with HH. We were able to detect oxidative modifications in different amino acid residues such as tryptophan, methionine and histidine In vitro by inducing oxidative stress and iron overload in commercial human serum transferrin (Sigma). The proteins were subjected to tryptic digestion prior to analysis by Q-TOF LC-MS/MS. The modified peptides were targeted for possible identification of oxidative modifications in plasma samples of patients of hereditary hemochromatosis.
Protein carbonylation and lipid peroxidation as biomarkers of oxidative stress
Protein carbonyl content is the most general and well-used biomarker of severe oxidative protein damage. Protein carbonyls have a major advantage over lipid peroxidation products as markers of oxidative stress because of their stability and their early and prolonged circulation in the blood. In our experiments, we used the detection of protein carbonyls as a preliminary and general procedure to indicate if oxidative stress has a role in the pathophysiology of HH. For this purpose, 2,4-dinitrophenylhydrazine (DNPH) was used to detect protein carbonyls in the plasma samples of untreated patients with HH. This technique is based on the reaction between protein carbonyls and DNPH resulting in the formation of a Schiff base to produce the corresponding hydrazone, which can be analyzed spectrophotometrically. A significantly high content of protein carbonyls (1-7 times), compared to the control, was detected. These findings correlate positively with the relative levels of serum ferritin. Carbonyl contents of homozygous or heterozygous individuals for C282Y and H63D support the suggestion of the involvement of oxidative stress in the pathogenesis of HH due to oxidative modifications of Trf, regardless of whether the patients were homozygous or heterozygous for the C282Y and H63D mutations (unpublished observation). The positive correlation between high plasma carbonyl content and high plasma ferritin suggests that the pool of catalytic iron increases in parallel with hepatic iron and may be linked to enhanced lipid peroxidation. This positive correlation still does not explain any direct links between HFE and ferritin metabolism, but it is possible that the abnormal protein synthesized as a consequence of mutated HFE gene directly or indirectly leads to disturbances in ferritin metabolism or iron loading. In HH, elevated plasma ferritin occurs in the absence of architectural damage to the liver, suggesting that the elevated plasma ferritin most likely results from enhanced secretion of ferritin rather than tissue damage. At this point, the plasma proteins that are oxidatively modified in untreated patients with HH, as measured by carbonyl assay, have not yet been characterized, as the elevation of carbonyl levels may be due to the oxidation of any other plasma protein rather than transferrin. We characterized the oxidatively modified plasma protein (Trf) by using an antibody to isolate it for tryptic digestion and Q-TOF LC-MS/MS analysis.
In our in vitro experiments, we induced oxidative stress in commercial protein standards (Human Serum Trf) using hydrogen peroxide, which has been extensively used as an oxidant. As is known, most oxidative damage in tissues requires the participation of catalytically active iron. Free iron can catalyze the decomposition of hydroperoxides, including hydrogen peroxide, resulting in the formation of highly reactive substances that promote lipid peroxidation and other oxidative damage reactions. An increase in this reactive iron is believed to be a pathophysiological factor in several diseases accompanied by oxidative damage. To prevent oxidative damage, a system has evolved to limit the concentration of reactive iron while also providing iron for biochemical synthesis. Protein oxidation in mammalian cells is generally accompanied by the degradation of oxidized protein molecules. However, hydrogen peroxide-induced protein oxidation enhances the proteolytic susceptibility of the damaged protein. In our in vitro experiments, we detected oxidative damage to Trf molecules following exposure to two different concentrations of hydrogen peroxide (10 and 20 µM). This oxidative damage leads to the modification of both proteins, confirmed by Q-TOF LC-MS/MS, which detected oxidatively modified peptide fragments containing oxidized methionine, histidine, and tryptophan, identified using PEAKS software.
We used EDTA in our first set of experiments along with hydrogen peroxide as EDTA-Fe (III) complexes to effectively catalyze ·OH formation, as reported by Aust, et al. [16] The rate of lipid peroxidation is dependent upon the ratio of chelate (EDTA) to ferric iron. A ratio of less than 1 maximizes the rate of lipid peroxidation. A ratio of 1:1 is still able to initiate lipid peroxidation; however, a ratio above 1 causes inhibition of lipid peroxidation. The concentration of EDTA used in our experiments was 10 mM, chosen to stop the oxidation reaction at a specific point prior to the dialysis step and to enhance the autoxidation of proteins. However, we did not detect protein carbonyls in our In vitro experiments using Q-TOF LC-MS/MS, probably due to the low concentration of hydrogen peroxide (10, 20 µM) or the absence of derivatization with DNPH prior to the oxidation process (unpublished observation). Headlam, et al. [17] indicated that the reaction of bovine serum albumin (BSA) with hydrogen peroxide alone over the range of 290-1450 µM produced only low levels of released carbonyls, and the yield of these materials did not increase significantly with increasing oxidant concentration (lowest yields compared to HOCl, γ radiolysis, and other oxidants). However, the addition of Fe (II) (± EDTA) at a fixed concentration to hydrogen peroxide (290 µM) significantly increased the levels of released carbonyls. In contrast, increasing concentrations of Fe (II)-EDTA (in the absence of hydrogen peroxide) gave significant dose-dependent increases in the yields of released carbonyl compounds.
Auto-oxidation and iron incorporation in Trf molecules
Iron uptake by Trf has been analyzed by a relatively small number of investigators. The goal of the second part of our second set of In vitro experiments was to incorporate iron within human serum Trf using ferric nitrilotriacetate along with two different concentrations of hydrogen peroxide (10, 20 µM) without the involvement of an iron chelator (EDTA). Twenty mM of sodium bicarbonate was added to Trf to extract iron rapidly from ferric nitrilotriacetate, yielding an iron-loaded C-site complex that deprotonates and undergoes a fast change in conformation, followed by loss of two or three protons, which, in turn, leads to iron uptake by the N-site.
The reaction of ferric salts with Trf has been extensively studied by Bates, et al. [18] who reported that adding iron salts to buffered Trf solutions in the neutral to alkaline pH range gives poor results. This correlated with our preparations by adding nitrilotriacetic acid to ferric chloride at pH 2, then raising it gradually to 6, which provides a rapid and stable chelate-free ferric transferrin. Bates, et al. [18] also reported that titration of Trf with ferric nitrilotriacetate gives a linear function and a clear endpoint, while titration with ferric chloride results in a sigmoidal-shaped curve and no clear endpoint. According to them, spectral data indicate that only 5% to 25% of the iron becomes bound when 1 eq. of ferric chloride is added to Trf at neutral pH, with the remaining sites vacant and available for reaction with ferric nitrilotriacetate. In our methods, we allowed one and two equivalents of ferric nitrilotriacetate to react with Trf to bind the C-site iron load and total (C+N)-site iron load, respectively.
As expected, we detected significantly more modified methionine, tryptophan, and histidine peptides when using 2 equivalents of ferric nitrilotriacetate due to the occupation of both C- and N-sites with iron rather than only the C-site. Consequently, iron uptake by Trf leads to protein damage, detected as oxidative modifications of methionine, histidine, and tryptophan. However, no significant difference was observed between samples treated with low and high concentrations of hydrogen peroxide. The decomposition of hydrogen peroxide by ferric ions occurs, but is considerably slower than the Fenton reaction. Like the Fenton reaction, it appears to be a redox chain reaction.
Fe (III) + H2O2 Fe (II) + HO2· + H
This reaction, as indicated above, has an acidic pH optimum. At neutral pH, the reaction is extremely slow due to the tendency of ferric ions to hydrolyze. The reduction of ferric ions is critical as transferrin molecules have a weak affinity for ferrous ions that would facilitate its release, leading to transferrin autoxidation [16]. It is speculated that at low pH, decreased stability of the Fe (III)-Trf complex and the involvement of anions such as phosphate and bicarbonate are crucial for Trf autoxidation. Iron incorporation has been reported In vivo by Bacon, et al. [19] after a single intraperitoneal injection of rats with ferric nitrilotriacetate (Fe-NTA) which gives rise to evenly distributed iron deposits over the hepatic lobules compared with the heavy iron deposits in hepatocytes due to dietary carbonyl iron. This is due, in part, to saturation of Trf with subsequent increased endocytosis in a scenario which resembles a model for hereditary hemochromatosis [19].
Is iron-loaded transferrin able to generate ·OH?
As known, Trf is the iron-transport protein of human plasma. In the presence of a suitable anion (carbonate), it binds two molecules of Fe (III) per mole of protein. There is a dispute in the literature concerning the ability of Trf-bound iron to accelerate ·OH formation and lipid peroxidation. McCord and Day [20] reported that iron-loaded transferrin promoted ·OH formation from superoxide and hydrogen peroxide at pH 7.4. This observation has been supported by others. Baldwin, et al. [21] indicated that iron-loaded Trf was not active in accelerating ·OH formation at pH 7.8. Halliwell, et al. [22] reported that ferric ions might become released from Trf at low pH values (e.g., in ischemic tissues or in the microenvironment of activated phagocytic cells) in a form able to promote radical reactions, since iron can be mobilized from the protein under acidic conditions.
We suggest that Trf-bound iron in vitro and in vivo is not active in accelerating oxidative damage at physiological pH unless a strong chelating agent is present. We attempted to address this possibility in our first set of in vitro oxidation experiments with ferritin and transferrin by using hydrogen peroxide and EDTA as a chelating agent in physiological PBS at pH 7.4. The outcome was damage to both proteins, leading to their autoxidation, with several peptides containing oxidized methionine, tryptophan, and histidine being detected.
Furthermore, in our second set of in vitro oxidation experiments with Trf, in the absence of EDTA, we noticed greater damage to the Trf molecule in the presence of carbonate and ferric nitrilotriacetate at an acidic pH, which promoted radical reactions. It seems that pH, as well as chelating agents, plays an important role in initiating oxidative injury.
- Van Campenhout A, Van Campenhout C, Lagrou A, Keenoy BM. Iron-induced oxidative stress in hemodialysis patients: A pilot study on the impact of diabetes. Biometals. 2008;21(1):159–70. Available from: https://doi.org/10.1007/s10534-007-9104-9
- Jakeman A, Thompson T, McHattie J, Lehotay DC. Sensitive method for nontransferrin-bound iron quantification by graphite furnace atomic absorption spectrometry. Clin Biochem. 2001 Feb;34(1):43–7. Available from: https://doi.org/10.1016/s0009-9120(00)00194-6
- Rudeck M, Volk T, Sitte N, Grune T. Ferritin oxidation In vitro: Implication of iron release and degradation by the 20S proteasome. IUBMB Life. 2000;49(6):451–6. Available from: https://doi.org/10.1080/152165400410317
- Conrad C, Marshall P, Malakowsky C. Oxidized proteins in Alzheimer’s Plasma. Biochem Biophys Res Commun. 2000;275(2):678–81. Available from: https://doi.org/10.1006/bbrc.2000.3356
- Chahine JM, Parkdman R, Abdalla F. A mechanism for iron uptake by transferrin. Eur J Biochem. 1996;236(3):922–31. Available from: https://doi.org/10.1111/j.1432-1033.1996.00922.x
- Chahine JM, Parkdman R, Abdalla F. Transferrin as a mixed chelate-protein ternary complex involved in iron intake by serum-transferrin in vitro. J Mol Biol. 1999;293(5):1273–84. Available from: https://doi.org/10.1006/jmbi.1999.3238
- Davies J, Shringarpure R, Grune T. Ubiquitin conjugation is not required for the degradation of oxidized proteins by the proteasome. J Biol Chem. 2003 Jan 3;278(1):311–8. Available from: https://doi.org/10.1074/jbc.m206279200
- Michielsen E, Diris C, Wodzig W, Dieijen-Visser M. Highly sensitive immunoprecipitation method for extracting and concentrating low-abundance proteins from human serum. Clin Chem. 2005 Jan;51(1):222–4. Available from: https://doi.org/10.1373/clinchem.2004.036251
- Sisson T, Castor W. An improved method for immobilizing IgG antibodies on protein A-agarose. J Immunol Methods. 1990;127(2):215–20. Available from: https://doi.org/10.1016/0022-1759(90)90071-3
- Levine R, Garland D, Oliver C, Amici A, Climent I, Stadtman E. Determination of carbonyl content in oxidatively modified proteins. Methods Enzymol. 1990;186:464–78. Available from: https://doi.org/10.1016/0076-6879(90)86141-h
- Levine R, Williams J, Stadtman E, Shacter E. Carbonyl assays for determination of oxidatively modified proteins. Methods Enzymol. 1994;233:346–57. Available from: https://doi.org/10.1016/s0076-6879(94)33040-9
- Reznick A, Packer L. Oxidative damage to proteins: Spectrophotometric method for carbonyl assay. Methods Enzymol. 1994;233:357–63. Available from: https://doi.org/10.1016/s0076-6879(94)33041-7
- Shacter E. Protein oxidative damage. Methods Enzymol. 2000;319:428–36. Available from: https://doi.org/10.1016/s0076-6879(00)19040-8
- Houglum K, Ramm G, Powell L, Chojkier M. Excess iron induces hepatic oxidative stress and transforming growth factor β1 in genetic hemochromatosis. Hepatology. 1997;26(3):605–10. Available from: https://doi.org/10.1002/hep.510260311
- Dalle-Donne I, Rossi R, Gagliano N, Milzani A. Protein carbonylation in human diseases. Trends Mol Med. 2003;9(4):169–76. Available from: https://doi.org/10.1016/s1471-4914(03)00031-5
- Aust S, Morehouse L, Thomas C. Role of metals in radical oxygen reactions. J Free Radic Biol Med. 1985;1(1):3–25. Available from: https://doi.org/10.1016/0748-5514(85)90025-x
- Headlam H, Davies J. Markers of protein oxidation: Different oxidants give rise to variable yields of bound and released carbonyl products. Free Radic Biol Med. 2004;36(9):1175–84. Available from: https://doi.org/10.1016/j.freeradbiomed.2004.02.017
- Bates G, Schlabach M. The reaction of ferric salts with transferrin. J Biol Chem. 1973;248(9):3228–32. Available from: https://pubmed.ncbi.nlm.nih.gov/4735577/
- Bacon BR, Tavill AS, Park CH. Hepatic lipid peroxidation In vivo in rats with chronic iron overload. J Clin Invest. 1983;71(2):429–39. Available from: https://doi.org/10.1172/jci110787
- McCord M, Day E. Superoxide-dependent production of hydroxyl radical catalyzed by the iron-EDTA complex. FEBS Lett. 1978;86(1):139–42. Available from: https://doi.org/10.1016/0014-5793(78)80116-1
- Baldwin D, Jenny E, Aisen P. The effect of human serum transferrin and milk lactoferrin on hydroxyl radical formation from superoxide and hydrogen peroxide. J Biol Chem. 1984;259(20):13391–4. Available from: https://pubmed.ncbi.nlm.nih.gov/6092375/
- Halliwell B, Gutteridge J. The importance of free radicals and catalytic metal ions in human diseases. Mol Aspects Med. 1985;8(2):89–193. Available from: https://doi.org/10.1016/0098-2997(85)90001-9
- Alexander J, Kowdley KV. HFE-associated hereditary hemochromatosis. Genet Med. 2009;11(5):307–13. Available from: https://doi.org/10.1097/gim.0b013e31819d30f2
- Aisen P. Transferrins, the transferrin receptor, and the uptake of iron by cells. In: Sigel A, Sigel H, editors. Metal Ions in Biological Systems. Vol. 23. New York: Marcel Dekker; 1998. p. 585–631. Available from: https://pubmed.ncbi.nlm.nih.gov/9444770/
- Thevis M, Ogorzalek Loo R, Loo JA. Mass spectrometric characterization of transferrins and their fragments derived by reduction of disulfide bonds. J Am Soc Mass Spectrom. 2003;14(6):635–47. Available from: https://doi.org/10.1016/s1044-0305(03)00199-5
- Van Campenhout A, Van Campenhout CM, Keenoy B. Transferrin modification and lipid peroxidation: Implications in diabetes mellitus. Free Radic Res. 2003;37(10):1069–77. Available from: https://doi.org/10.1080/10715760310001600390
- Reynolds L, Klein M. Iron poisoning – A preventable hazard of childhood. S Afr Med J. 1985;67(18):680–3. Available from: https://pubmed.ncbi.nlm.nih.gov/3992389/