
More Information
Submitted: May 07, 2025 | Approved: May 13, 2025 | Published: May 14, 2025
How to cite this article: Hamsho FA, Tahan ZS, Prevalence of Hemolysin (hlyA)-producing Uropathogenic E. coli and Phenolics-mediated Suppression: Experimental and Bioinformatic Evidence. Ann Proteom Bioinform. 2025; 9(1): 001-008. Available from:
https://dx.doi.org/10.29328/journal.apb.1001024
DOI: 10.29328/journal.apb.1001024
Copyright License: © 2025 Hamsho FA, et al. This is an open access article distributed under the Creative Commons Attribution License, which permits unrestricted use, distribution, and reproduction in any medium, provided the original work is properly cited.
Keywords: Urinary tract infections; Escherichia coli; Hemolysis; hlyA gene; Phenolic compounds

Prevalence of Hemolysin (hlyA)-producing Uropathogenic E. coli and Phenolics-mediated Suppression: Experimental and Bioinformatic Evidence
Fatima Al-Zahraa Hamsho* and Zaher Samman Tahan
Division of Microbiology, Department of Botany, Faculty of Sciences, University of Aleppo, Aleppo, Syria
*Address for Correspondence:Fatima Al-Zahraa Hamsho, Division of Microbiology, Department of Botany, Faculty of Sciences, University of Aleppo, Aleppo, Syria, Email: [email protected]
Urinary Tract Infections (UTIs) are common opportunistic diseases, primarily caused by Escherichia coli, which utilizes various virulence factors, including the hlyA gene encoding hemolysin. Phenolic compounds in fruits and vegetables, known for their antimicrobial properties, were examined for their effects on E. coli. This study involved 60 E. coli isolates from Aleppo University Hospital, identified via biochemical and molecular tests. The hemolytic ability was assessed phenotypically, and the hlyA gene was detected using PCR. The impact of pyrogallol and catechol on these isolates was also evaluated. Results showed a 54.6% isolation rate of E. coli, with a higher rate in females (71.7%) than males (28.3%). The 20-40 age group was most affected, comprising 38.4% of cases. Hemolytic activity was observed in 45% of isolates, and the hlyA gene was present in 41.6% of cases. Pyrogallol exhibited a bactericidal effect at high concentrations and mild growth at lower levels, while catechol showed no antibacterial effects. These experimental investigations were validated by docking those polyphenols to the hlyA predicted, validated 3D structure where pyrogallol exhibited stronger binding affinity than catechol (-5.2 vs. -4.8 kcal/mol). The study underscores the significance of the hlyA gene in E. coli virulence and highlights the potential antibacterial properties of phenolic compounds at specific concentrations.
Urinary Tract Infections (UTIs) are among the most common diseases worldwide, affecting men and women of all ages [1]. These infections can be caused by various Gram-positive and Gram-negative bacteria, but numerous studies have shown that Escherichia coli is the most common pathogen responsible for UTIs [2]. The incidence of E. coli-induced UTIs ranges from approximately 50% - 90% [3].
While E. coli normally inhabits the human intestines as a commensal organism, certain strains can cause UTIs and may progress to pyelonephritis [4]. The indiscriminate use of antibiotics has led to the emergence of antibiotic-resistant bacterial strains, prompting researchers to explore natural substances or chemical compounds, such as certain phenolic compounds, as alternatives to antibiotics [5].
Phenolic compounds are found in fruits, vegetables, and tea. They exhibit antioxidant, anticancer, and antibacterial properties and provide numerous health benefits. Catechol and pyrogallol are phenolic compounds found in plants, fruits, and vegetables. They act as antioxidants and antibacterial agents by affecting bacterial biofilms, proteins, and nucleic acids, leading to bacterial inhibition or death [6].
Uropathogenic E. coli (UPEC) are motile, facultative anaerobic, non-spore-forming Gram-negative bacilli that thrive in various environments. These strains have adapted to colonize both the lower and upper urinary tracts [7]. Their pathogenicity is attributed to various virulence factors, including iron-chelating siderophores, flagella, pili, lipopolysaccharides, and an array of toxins such as cytotoxic necrotizing factor [8].
One critical virulence factor is alpha-hemolysin (a-hemolysin), a 110 kDa protein encoded by the hlyA gene. This enzyme lyses red blood cells by forming pores in their membranes, leading to cell destruction and death to access nutrients and iron. This toxin is widespread among Gram-negative bacteria [9]. The hly operon consists of hlyC, hlyA, hlyB, and hlyD, as shown in Figure 1.

Figure 1: The hlyA operon and the function of each gene.
The hlyA protein exists as an inactive protoxin (prohemolysin) and is activated by the hlyC protein through the acylation of prohemolysin by the acyltransferase enzyme. The active toxin is then exported via an ATP-dependent secretion system. The hlyD and hlyB proteins, along with Ca2+ cofactors, facilitate the release, stabilization, and integration of the toxin into the host cell membrane, leading to cell and red blood cell lysis [10].
Studies have shown that this toxin is produced by about 50% of E. coli isolates causing UTIs [11]. The presence of a-hemolysin is associated with pyelonephritis [12]. Additionally, phenolic compounds have been demonstrated to have significant antibacterial effects [13].
Given the widespread prevalence of Urinary Tract Infections (UTIs) caused by Escherichia coli in both communities and hospitals, and considering the significant pathogenic role of uropathogenic Escherichia coli (UPEC), this research focuses on investigating the hemolysin gene (hlyA), studying its pathogenic role, and examining the effects of phenolic compounds on it. By linking these results with previous studies, we aim to establish a database specifically for UPEC strains prevalent among Syrian patients. Therefore, the aim of this study was to investigate UPEC isolated from Patients with Urinary Tract Infections and Detection of the Hemolysin Gene (hlyA) Using Phenotypic and Molecular Methods with PCR, and the Effect of Pyrogallol and Catechol on These Bacteria.
Study area
This research was conducted in the Microbiology Research Laboratory, Department of Plant Life Sciences, Faculty of Science, University of Aleppo, in collaboration with Aleppo University Hospital.
Media and chemicals
We used a wide array of media and chemicals during this study which are summarized in Table 1.
| Table 1: A collection of media used in this research. | ||
| Culture Media/chemical | Purpose of Use | Manufacturer |
| Nutrient Agar | Nutrient medium for purification, isolation, and cultivation of bacterial isolates | Himedia |
| Luria Bertani Broth | Activation of Escherichia coli isolates before DNA extraction | Liofilchem |
| MacConkey Agar | Differential medium to study the isolates' ability to ferment lactose | Himedia |
| Hi-chrome E.coli Agar | Selective and differential medium for E.coli bacteria to confirm the isolates belong to E.coli | Himedia |
| MR-VP Medium | Methyl red and Voges-Proskauer tests for acetoin detection | Himedia |
| Simon Citrate Agar | Determining bacteria's ability to use citrate as the sole carbon source | Himedia |
| Eosin Methylene-Blue (EMB) Agar | Selective and differential medium for E.coli containing lactose, sucrose, and an indicator dye | Liofilchem |
| Tryptophan Medium Broth | Differential medium for E.coli producing tryptophanase and releasing indole | Himedia |
| Brain Heart Infusion Broth | Cultivation medium | Himedia |
| Blood Agar | Used to test bacteria's ability to hemolyze blood | Himedia |
| Urea Agar Base | Testing urea decomposition or if the bacterium secretes urease enzyme | Srlchem |
| Pyrogallol | Phenolic compound to study its effect on bacteria | MERCK |
| Catechol | Phenolic compound to study its effect on bacteria | MERCK |
Sampling: Urine samples were collected from Aleppo University Hospital between March 28, 2023, and October 15, 2023, from patients with symptoms of urinary tract infections. Samples were collected in sterile urine collection containers, from the midstream urine. Each sample was accompanied by an information sheet that included details about the patient's condition, gender, age, and clinical symptoms.
Urine macroscopic examination: Urine was examined macroscopically to determine color, odor, and turbidity. Pathological findings in the urine, such as red blood cells, urinary epithelial cells, and crystals, were investigated [14].
Culturing samples: Urine samples were cultured on MacConkey Agar using the Urine Culture Method [15]. Samples were then purified on Nutrient Agar to obtain pure and isolated colonies.
Bacterial identification: The morphological and cultural characteristics of the bacteria growing on MacConkey Agar were studied. Bacterial identification was then carried out by performing the tests listed in the Bergey's Manual of Determinative Bacteriology [16]. The findings of biochemical identification tests are provided in Table 2.
| Table 2: Shows the results of biochemical tests. | |
| Test | Result |
| Gram Stain | - |
| Catalase | + |
| Methyl Red | + |
| Indole | + |
| Oxidase | - |
| Voges-Proskauer | - |
| Urea | - |
| Simon Citrate | - |
Investigation of Escherichia coli hemolytic activity (hemolysin test)
E. coli bacteria were cultured on Blood Agar supplemented with 5% blood and Bacterial incubator by Gemmy Industrial Corp for 24 hours at 37 °C. The presence of a hemolytic halo around the colony was studied as an indicator of the bacteria's ability to hemolyze blood [17].
The hemolysis assay using liquid cultures was performed similarly to the method previously described [17]. Bacterial cells were added at a concentration of 1 × 10⁷ colony-forming units per milliliter (CFU/mL) to tryptic soy broth supplemented with 5% sheep red blood cells and 10 mM calcium chloride. The mixture was incubated at 37 °C for 6 hours. After incubation, the mixture was centrifuged, and the amount of hemoglobin released from lysed red blood cells in the supernatant was measured by spectrophotometry at a wavelength of 540 nm. The same amount of red blood cells added to distilled water was considered as total hemolysis (A540 of total). The percentage of hemolysis for each sample was calculated using the equation: Percentage of hemolysis = 100 × (A540 of sample - A540 of background) / (A540 of total - A540 of background) [18].
Extraction of DNA
Active E.coli bacteria were cultured in LB Broth medium and incubated for 24 hours at 37 °C. Then, 1.5 ml of the growing culture was taken and centrifuged at 10,000 rpm for 5 minutes. The supernatant was discarded, and the pellet was resuspended in 200 µl of TE solution. The mixture was incubated in a water bath at 100 °C for 10 minutes, then immediately transferred to an ice bath for 10 minutes. The samples were then centrifuged at 14,000 rpm for 5 minutes at 4 °C. The supernatant was collected into an Eppendorf tube and stored at -20 °C until use [19]. The presence of DNA was confirmed by running on a 2% agarose gel.
Detection of the hlyA gene
The presence of the hlyA gene in bacterial isolates was investigated using specific primers produced by Thermo Fisher Scientific, as described by [20], shown in Table 3.
| Table 3: PCR for the hlyA Virulence Factor. | ||
| Reference | Size of Product (bp) | Primer Sequence |
| [20] | 1177 | F: AACAAGGATAAGCACTGTTCTGGCT (5' - 3') |
| R: ACCATATAAGCGGTCATTCCCGTCA (5' - 3') | ||
PCR reaction components
The PCR mixture for the hlyA gene was prepared in a 20 µl volume containing: 2 µl of the extracted DNA template, 10 µl of master mix from Biobasic, 0.6 µl of each primer, and 6.8 µl of double-distilled water [20].
PCR amplification conditions for the hlyA gene
The gene was amplified using a Thermal cycler by Peqlab with the cycling conditions described by Johnson and his colleagues [20] as provide in Table 4. The samples were then run on a 2% agarose gel from Biobasic with ethidium bromide from Titan Biotech Ltd and a 100 bp DNA Ladder from GeneDirex on an electrophoresis unit by Labtech device at 100 volts for 30 minutes. After electrophoresis, the gel was placed in a UV transilluminator by Uvitec equipped with a digital camera.
| Table 4: Thermal Cycling Conditions for the hlyA Gene | |||
| Cycles | Time | Temperature (°C) | Phase |
| 1 | 12 minutes | 95 | Initial Denaturation |
| 25 | 30 seconds | 94 | Denaturation |
| 30 seconds | 63 | Annealing | |
| 3 minutes | 68 | Extension | |
| 1 | 10 minutes | 72 | Final Extension |
Effect of phenolic compounds on tested bacteria
Preparation of blood agar medium: The medium was prepared according to the manufacturer's instructions, with 5% blood added. Different concentrations of pyrogallol and catechol (15 mM, 30 mM) were prepared. Each solution was added separately to the medium using a filter, and the tested bacteria were cultured. The plates were incubated at 37 °C for 24 hours [21].
Protein retrieval, structure prediction
The amino acid sequence of hlyA was retrieved from Uniprot ID#O68404. This sequence is then imported to AlphaFold 3 platform [22] to conduct tertiary structure prediction. On the flip side, phenols molecular structure was retrieved from PubChem repository through IDs 289 for catechol and 1057 for pyrogallol.
Refinement and structure assessment
The predicted 3D structure from AlphaFold 3 was refined via GalaxyRefine 2 web server [23]. Afterward, we assessed the difference of structure validity through Swiss-Model structure assessment tool [24]. These included MolProbity parameters such as MolProbity Score, clash score, Ramachandran favoured, and Ramachandran outliers, among others.
Active site prediction
The refined 3D structure of hlyA was submitted to CASTp 3 [25] for the prediction of active pocket using the default options.
Molecular docking
The refined and validated model was uploaded along with phenols in question to perform molecular docking using CB-DOCK-2 online tool employing AutoDock vina [26]. Center coordinates of 9, -14, -6 and size of 22, 15, 15 that are compatible with the predicted active site using CASTp 3 server. The server uses 8 exhaustiveness. The docked complexes were analyzed through the output of the same server and, subseqnetly visualized via Discovery studio 2021 software.
Percentage of positive culture samples
Out of 244 urine samples, 134 were culture-negative (54.9%), while 110 were culture-positive (45.1%), as shown in Table 5.
| Table 5: Percentage of Positive and Negative Culture Samples: | ||
| Sample Type | Number of Samples | Percentage (%) |
| Negative | 134 | 54.9% |
| Positive | 110 | 45.1% |
| Total | 244 | 100% |
These percentages differ from an Indian study by Ponnusamy, et al. 2012, [27] which reported 87.9% positive cultures and 12.1% negative cultures. Another study by Shah, et al. 2019, [28] found a positive culture rate of 16.11%.
Results of bacterial identification for E. coli
60 E. coli isolates were obtained. They were Gram-negative bacilli, catalase-positive, methyl red-positive, indole-positive, oxidase-negative, unable to produce acetoin in the Voges-Proskauer test, and negative for urease and citrate, as summarized in Table 6.
| Table 6: Biochemical Test Results: | ||
| Test | Result | Percentage (%) |
| Gram Stain | - | 100% |
| Catalase | + | 100% |
| Methyl Red | + | 100% |
| Indole | + | 100% |
| Oxidase | - | 100% |
| Voges-Proskauer | - | 100% |
| Urea | - | 100% |
| Simon Citrate | - | 100% |
Percentage of E. coli isolation from positive samples
E. coli isolation rate was 54.6%, while other bacterial species accounted for 45.4%.
This percentage aligns with a 2019 study in Nepal by Shah, et al. [28], which reported an E. coli isolation rate of 57%. It is also close to an Iranian study reporting E. coli rates of 65-75% [29], but differs from an Iraqi study with a 27.5% isolation rate [30].
Isolation rate of E. coli from positive samples by age
E. coli was most frequently isolated from the 20-40 age group at 38.4%, followed by age elderly group (25%) and people with 40-60 years (20%). This result can be explained by the fact that individuals in this age group are in their sexually active years and may experience pregnancy and related changes [31]. These results are similar to those of Salman, et al. 2013, who found an isolation rate of 37% in the 21-25 age group and the lowest rate in those over 40 years at 0.6%. These rates vary due to social and economic factors, sexual activity, personal hygiene, and urinary system cleaning methods. Another study in Iran by Tabasi, et al. 2015 [3], found the highest isolation rate in the 31-40 age group at 45.2%. In contrast, an Indian study by Jadhav, et al. 2011 [32], reported the highest infection rate among those aged 60 and above due to factors like diabetes, reduced bladder emptying efficiency, and certain medications, creating a favorable environment for bacterial colonization in the urinary tract.
Isolation rate of E. coli from positive samples by gender
The isolation rate of E. coli from males was 28.3%, while it was 71.7% from females. This study is consistent with several other reports, including Tabasi, et al. [3] who identified prevalence of the positive isolates in 20.5% in male and 79.5% in female. Similarly, Kumar, et al. [33] showed 33.3% of male had E. coli while 66.7% of female had not.
Many studies have shown that females have a higher rate of urinary tract infections due to a shorter urethra, pregnancy-related anatomical and hormonal changes, and the proximity of the anus to the urethra [31]. An Iranian study indicated that prostate fluids in males act as an antibacterial agent [34].
Hemolysis ability of bacteria by phenotypic methods
Our screening found that 33 isolates were non-hemolytic (55%) whereas 27 isolates were hemolytic (45%). The phenotypic test of hemolysis is provided in Figure 2.
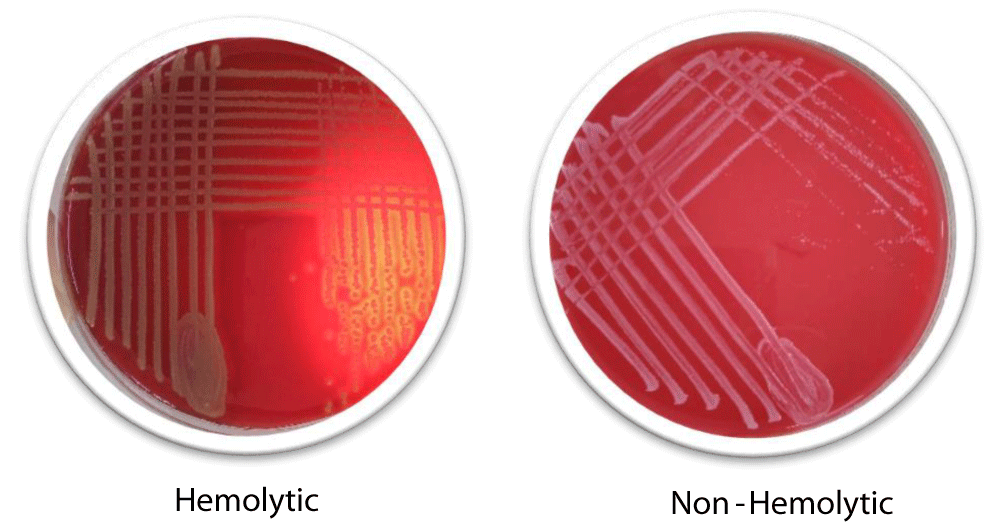
Figure 2: Phenotypic Hemolysis Test.
These results are both consistent and inconsistent with various global studies, as shown in Table 7. This indicates the pivotal role of hemolysis during the pathogenicity of E. coli.
| Table 7: Global Study Results for Phenotypic Hemolysis Test. | ||
| Non-Hemolytic Percentage | Hemolytic Percentage | Reference |
| 66% | 34% | [3] |
| 59% | 41% | [31] |
| 68% | 32% | [33] |
| 43% | 57% | [35] |
| 67.7% | 32.3% | [28] |
| 55% | 45% | Present study |
Quantitative hemolysin test
We also quantitatively determined the percentage of hemolysis as a result of UPEC. Results showed that the amount of released hemolysin was 37.3%. Moreover, upon adding pyrogallol, 34% of hemolysin activity was inhibited at 15mM. This gives rise a conclusion that pyrogallol had a direct inhibitory action against hemolysin.
Distribution of the hlyA gene
25 out of 60 E. coli isolates carried the hlyA gene, representing 41.6%, while the remaining isolates were negative for the hlyA gene. The presence of the targeted gene was indicated by 1177 bp band as in Figure 3.
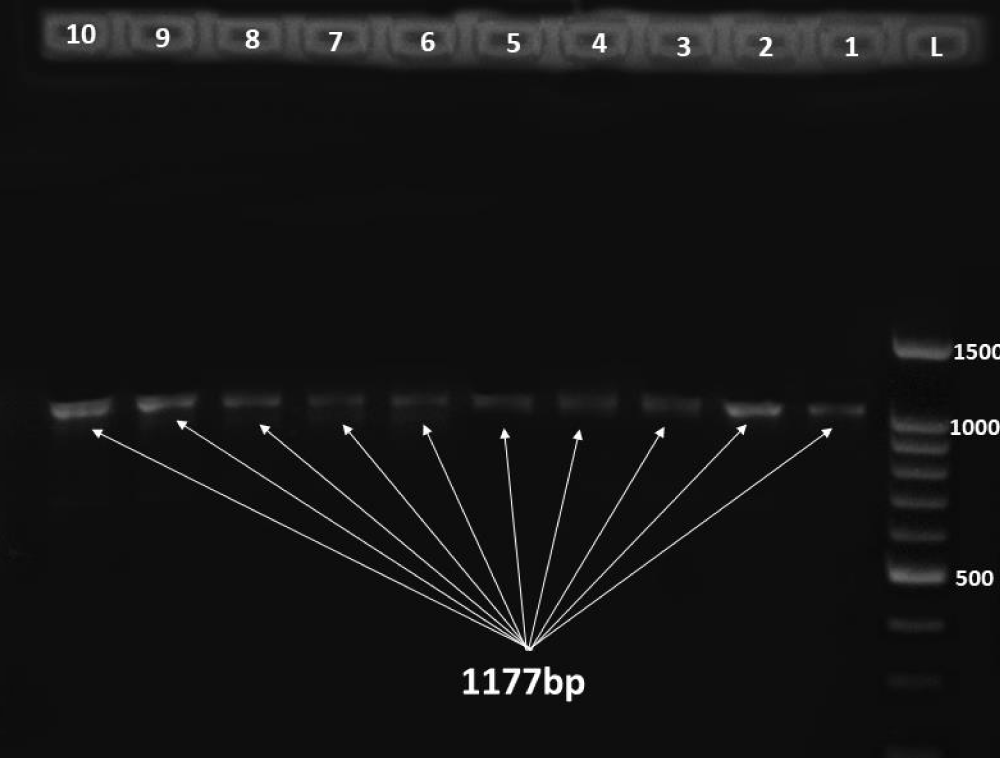
Figure 3: Gel electrophoreses of the hlyA with size 1177 bp where L is DNA ladder 100 bp and each specimen is number sequentially.
These results are similar to several other studies, as shown in the Table 8.
| Table 8: Global Studies on the Prevalence of the hlyA Gene. | |
| hlyA Gene Prevalence Percentage | Reference |
| 51.5% | [36] |
| 41.7% | [33] |
| 23.3% | [37] |
| 21.7% | [38] |
| 5% | [39] |
| 0% | [30] |
| 41.6%, | Present study |
This study aligns with many previous studies. The results of this study match those of Kumar, et al. 2022 [33], where the prevalence of the hlyA gene was 41.7%, and are close to those of Dadi, et al. 2020, with a prevalence of 51.5%. In contrast, Oliveira, et al. [39], found the hlyA gene in only 5% of isolates, and Salman, et al. 2013 [30], found no isolates with the hlyA gene. The high concordance between phenotypic and molecular methods indicates a strong relationship between phenotypic hemolysis tests and the presence of the hlyA gene in E. coli.
Effect of pyrogallol and catechol on bacteria
At a concentration of 15 mM, pyrogallol showed light growth of E. coli without hemolysis, while at 30 mM, no bacterial growth was observed (Figure 4). Several studies have shown that low concentrations can inhibit bacterial growth, while high concentrations are bactericidal due to the disruption of proteins, nucleic acids, and cell membranes [21,40]. Catechol showed no effect on pathogenic E. coli at both 15 mM and 30 mM concentrations (Figure 4).
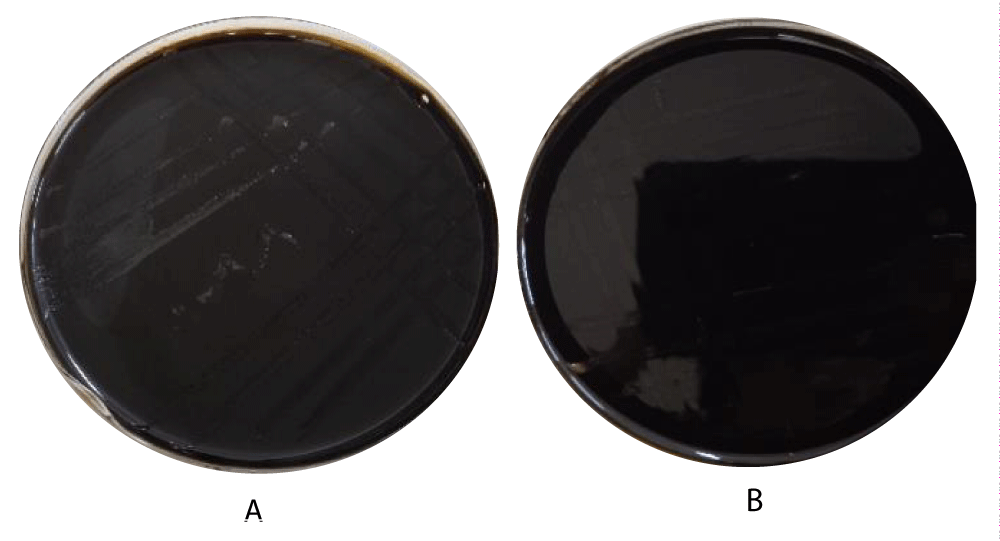
Figure 4: A:15 mM, pyrogallol showed light growth of E. coli without hemolysis, B: at 30 mM, no bacterial growth.
Structure prediction
The 3D structure of the hlyA enzyme predicted from AlphaFold 3 is illustrated in Figures 5,6. The structure is composed primarily from α-helix, intervened by a number of coils. The predicted structures should be first refined before performing any docking further.
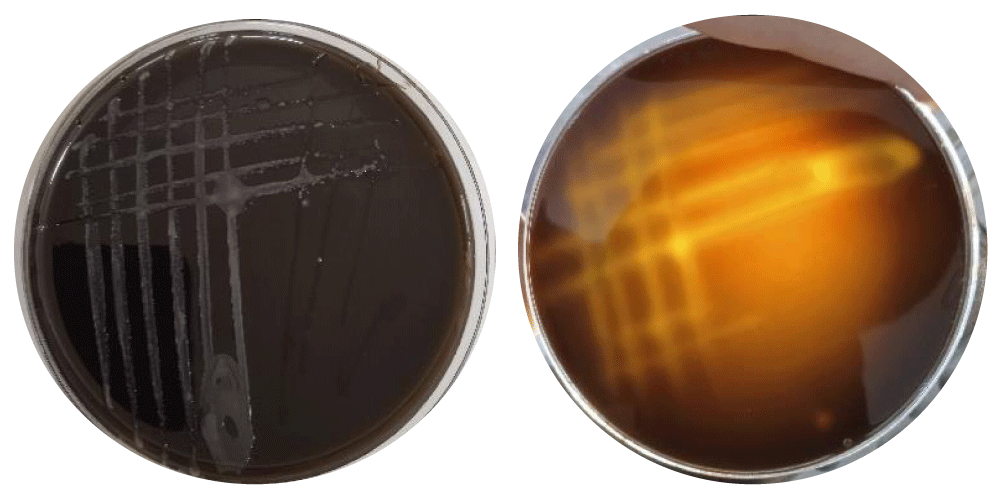
Figure 5: Catechol showed no effect on pathogenic E. coli at both 15 mM and 30 mM concentrations.
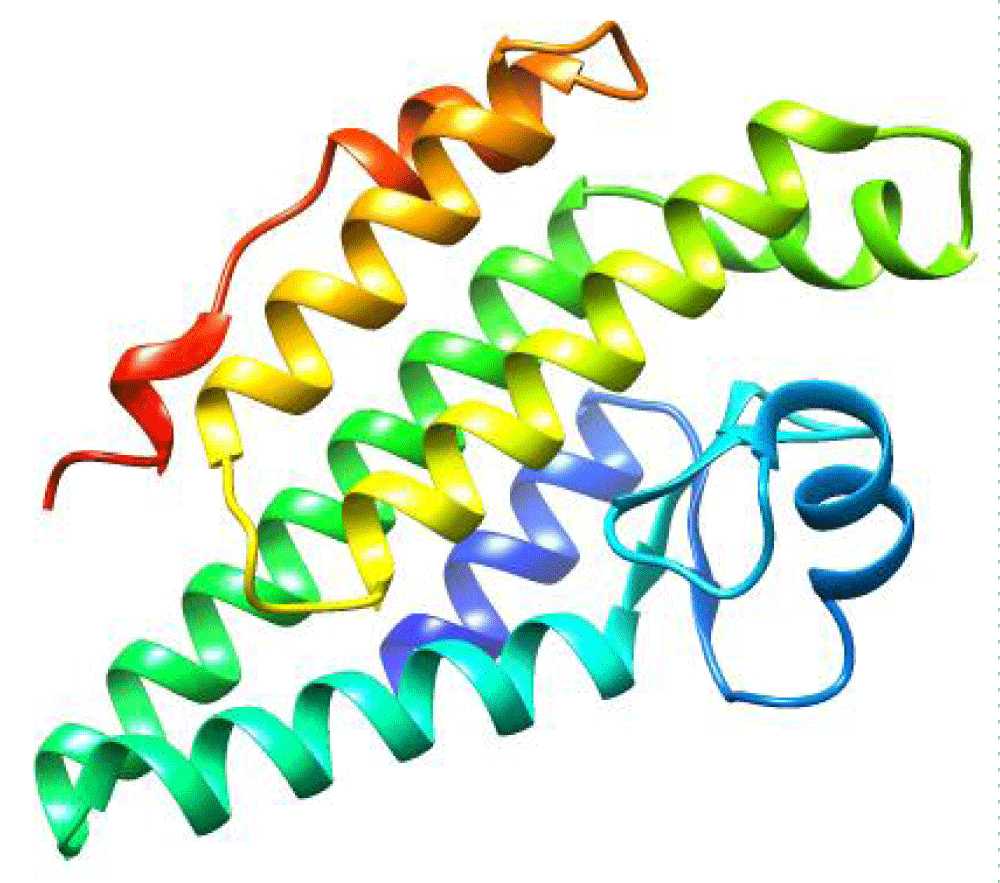
Figure 6: Tertiary structure of hlyA enzyme as predicted by AlphaFold 3 platform, colored in rainbow.
Refinement and validation
As summarized in Table 9, the MolProbity score was reduced to 1.25 while clash score substantially diminished from 26.51 to 4.79. Likewise, Ramachandran Favoured areas were maximally enhanced (100%), besides alleviating rotamer outliers to 0% as depicted in Figure 7. These findings confirm the great improvement and relaxation of the predicted 3D structure of hemolysin A making it ready for molecular docking.
| Table 9: Comparison between native and refined models of hlyA using Swiss-Model structure assessment. | ||
| Molprobity parameter | Native | Refined |
| MolProbity Score | 2.23 | 1.25 |
| Clash Score | 26.51 | 4.79 |
| Ramachandran Favoured | 96.65% | 100.00% |
| Ramachandran Outliers | 0.56% | 0.00% |
| Rotamer Outliers | 1.35% | 0.00% |
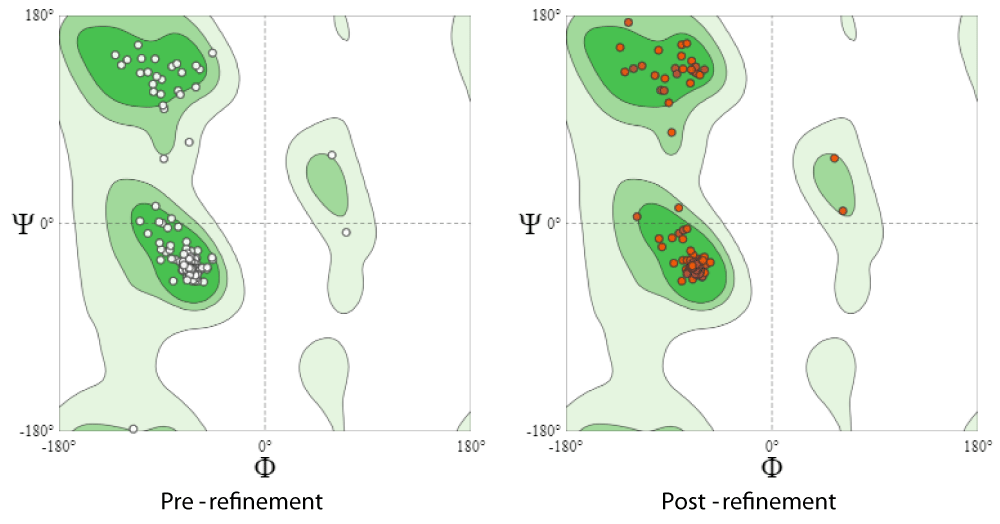
Figure 7: Ramachandran plot for native as well as refined model of hlyA through utilizing GalaxyRefine 2 server.
Active site prediction
The predicted active site has an area of 259.823 Å2 and volume of 136.906 Å3. This cavity is corresponding to pocket 3 provided in CB-DOCK-2 web server. This cavity encompasses segregated amino acid residues at positions around 60-68, 75-88 and 134-144 as in Figure 8.
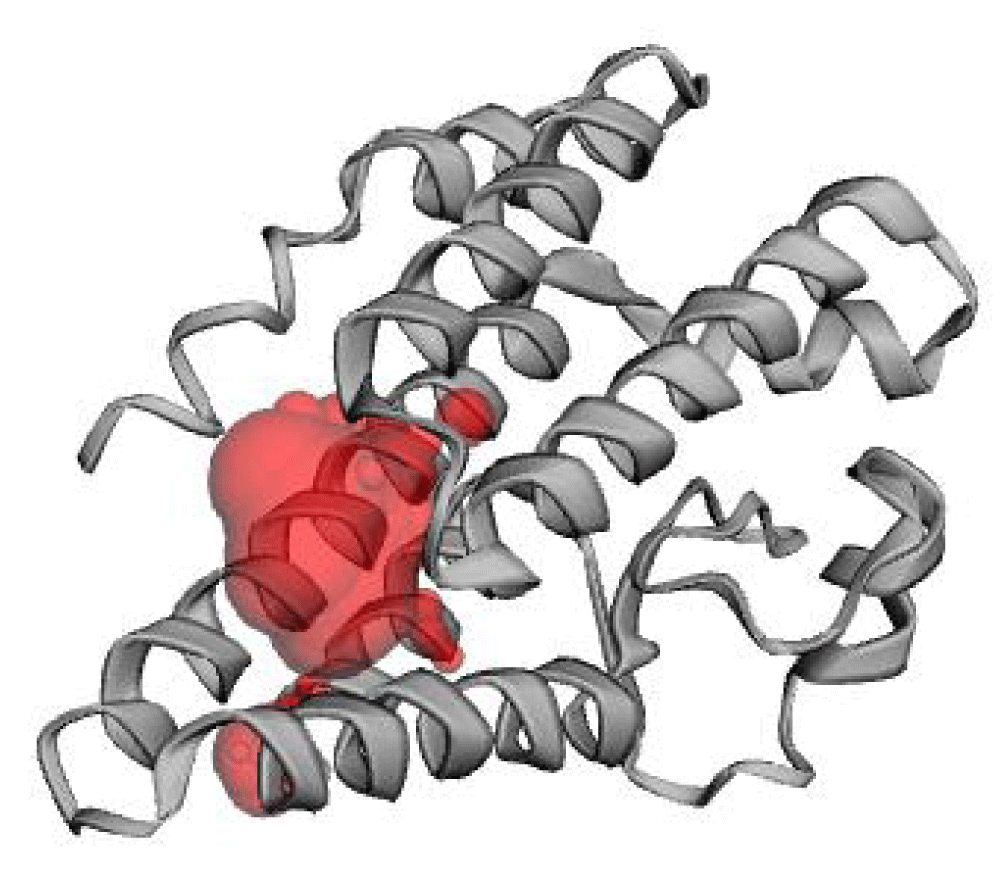
Figure 8: Localization of the predicted active pocket of hlyA using CASTp 3. The predicted pocket is shown in red.
Molecular docking
The docking scores of both phenols, catechol and pyrogallol were the same -4.8 kcal/mol versus -5.2 kcal/mol for pyrogallol. Moreover, the detailed investigation of type of bonding using Discovery studio revealed the formation of 2 hydrogen bonds with Ile 138 and Asn 140 in case of catechol. However, pyrogallol involved the formation of similar number of H-bonds but with distinct residues, i.e. with Ala 135 and Ser 137. Uniquely, unfavorable acceptor-acceptor distraction was observed between Asn 140 and one of the hydroxyls O. Both phenols showed pi-pi interactions with Tyr 61 (Figure 9).
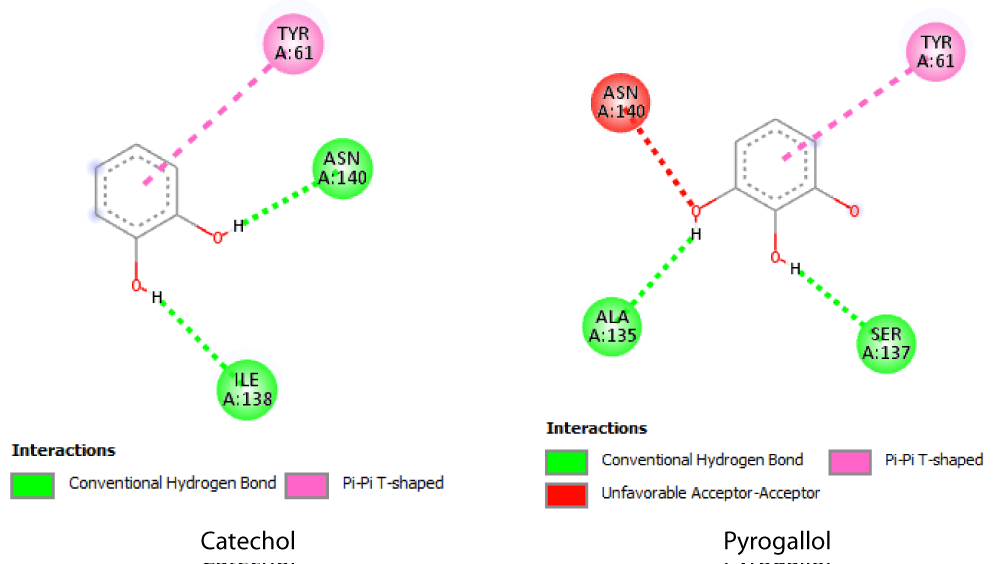
Figure 9: 2D hlyA-phenols interaction as elucidated by Discovery studio visualizer.
Therefore, the higher activity in the experimental tests, quantitative hemolysin activity in particular, can be interpreted in light of molecular docking computations. Our in-silico analysis showed that pyrogallol had higher binding affinity toward hlyA structure than catechol. This difference can be traced to the higher number of OH groups capable of forming more H-bonds and the relative higher occupancy within the active cavity of the enzyme.
The current study indicates that E. coli is prevalent across different age groups, causing urinary tract infections, with a higher infection rate in females than males. The most affected age group was 20-40 years. Phenotypic hemolysis was observed at a higher rate than the molecular detection of the hlyA gene. Pyrogallol demonstrated a clear inhibitory effect on E. coli growth and hemolytic activity, whereas catechol showed no antimicrobial activity against these bacteria. The prevalence of the hlyA gene in this study was consistent with global findings, with most E. coli isolates carrying the hlyA virulence gene.
Recommendations include conducting further studies to identify other virulence factors of E. coli responsible for urinary tract infections, performing more molecular studies to identify hemolysis genes in other bacterial species, and conducting further research to confirm the effectiveness of pyrogallol and catechol on bacteria.
Author contribution
Data curation, methodology, validation and drafting the manuscript: FAH; Conceptualization, investigation, supervision, editing and reviewing the manuscript: ZS.
Informed consent: Informed Consent was obtained from all the participants involved in the study
Ethics statement
The need of informed consent and ethical approval was exempted by the Institutional Review Board (Ethics and Research Committee at University of Aleppo), as it does not involve any patient intervention requiring informed consent or safety oversight. The research carried out on human data was adhered to the Declaration of Helsinki.
Data availability statement: All data generated or analysed during this study are included in this published article.
- Yazdanpour Z, Tadjrobehkar O, Shahkhah M. Significant association between genes encoding virulence factors with antibiotic resistance and phylogenetic groups in community acquired uropathogenic Escherichia coli isolates. BMC Microbiol. 2020;20(1):241. Available from: https://doi.org/10.1186/s12866-020-01933-1
- Ghavidel M, Gholamhosseini-Moghadam T, Nourian K, Ghazvini K. Virulence factors analysis and antibiotic resistance of uropathogenic Escherichia coli isolated from patients in northeast of Iran. Iran J Microbiol. 2020;12(3):223-230. Available from: https://pubmed.ncbi.nlm.nih.gov/32685119/
- Tabasi M, Karam MR, Habibi M, Yekaninejad MS, Bouzari S. Phenotypic assays to determine virulence factors of uropathogenic Escherichia coli (UPEC) isolates and their correlation with antibiotic resistance pattern. Osong Public Health Res Perspect. 2015;6(4):261-268. Available from: https://doi.org/10.1016/j.phrp.2015.08.002
- Bien J, Sokolova O, Bozko P. Role of uropathogenic Escherichia coli virulence factors in development of urinary tract infection and kidney damage. Int J Nephrol. 2012;2012:681473. Available from: https://doi.org/10.1155/2012/681473
- Liu B, Zhou C, Zhang Z, Roland JD, Lee BP. Antimicrobial property of halogenated catechols. Chem Eng J. 2021;403:126340. Available from: https://doi.org/10.1016/j.cej.2020.126340
- Wang J, Shen X, Yuan Q, Yan Y. Microbial synthesis of pyrogallol using genetically engineered Escherichia coli. Metab Eng. 2018;45:134-141. Available from: https://doi.org/10.1016/j.ymben.2017.12.006
- Ahmed N, Zeshan B, Naveed M, Afzal M, Mohamed M. Antibiotic resistance profile in relation to virulence genes fimH, hlyA and usp of uropathogenic E. coli isolates in Lahore, Pakistan. Trop Biomed. 2019;36(2):559-568. Available from: https://pubmed.ncbi.nlm.nih.gov/33597418/
- Xicohtencatl-Cortes J, Cruz-Cordova A, Cazares-Dominguez V, Escalona-Venegas G, Zavala-Vega S, Arellano-Galindo J, et al. Uropathogenic Escherichia coli strains harboring tosA gene were associated to high virulence genes and a multidrug-resistant profile. Microb Pathog. 2019;134:103593. Available from: https://doi.org/10.1016/j.micpath.2019.103593
- Fonseca-Martínez SA, Martínez-Vega RA, Farfán-García AE, González Rugeles CI, Criado-Guerrero LY. Association between uropathogenic Escherichia coli virulence genes and severity of infection and resistance to antibiotics. Infect Drug Resist. 2023;16:3707-3718. Available from: https://doi.org/10.2147/idr.s391378
- Velasco E, Wang S, Sanet M, Fernández-Vázquez J, Jové D, Glaría E, et al. A new role for Zinc limitation in bacterial pathogenicity: modulation of α-hemolysin from uropathogenic Escherichia coli. Sci Rep. 2018;8(1):6535. Available from: https://doi.org/10.1038/s41598-018-24964-1
- Murthy AMV, Phan MD, Peters KM, Nhu NTK, Welch RA, Ulett GC, et al. Regulation of hemolysin in uropathogenic Escherichia coli fine-tunes killing of human macrophages. Virulence. 2018;9(1):967-980. Available from: https://doi.org/10.1080/21505594.2018.1465786
- Nhu NTK, Phan MD, Forde BM, Murthy AM, Peters KM, Day CJ, Schembri MA. Complex multilevel control of hemolysin production by uropathogenic Escherichia coli. MBio. 2019;10(5):e02248-19. Available from: https://doi.org/10.1128/mbio.02248-19
- Batey SF, Davie MJ, Hems ES, Liston JD, Scott TA, Alt S, et al. The catechol moiety of obafluorin is essential for antibacterial activity. RSC Chem Biol. 2023;4(11):926-941. Available from: https://doi.org/10.1039/D3CB00127J
- Oyaert M, Delanghe J. Progress in automated urinalysis. Ann Lab Med. 2019;39(1):15-22. Available from: https://doi.org/10.3343/alm.2019.39.1.15
- Tewawong N, Kowaboot S, Pimainog Y, Watanagul N, Thongmee T, Poovorawan Y. Distribution of phylogenetic groups, adhesin genes, biofilm formation, and antimicrobial resistance of uropathogenic Escherichia coli isolated from hospitalized patients in Thailand. PeerJ. 2020;8:e10453. Available from: https://doi.org/10.7717/peerj.10453
- Garrity GM, Brenner DJ, Krieg NR, Staley JR. Systematic bacteriology. The Proteobacteria, Part C: The Alpha-, Beta-, Delta-, and Epsilonproteobacteria. In: Bergey’s Manual of Systematic Bacteriology. 2nd ed. New York: Springer; 2005. Available from: https://scirp.org/reference/referencespapers?referenceid=42923
- Al-Hadithi HA. Molecular detection of Hemolycin in Escherichia coli and attempt to inhibition by using the Probiotics. Tikrit J Pure Sci. 2018;23(6):79-90. Available from: http://dx.doi.org/10.25130/tjps.v23i6.675
- Taneike I, Zhang HM, Wakisaka-Saito N, Yamamoto T. Enterohemolysin operon of Shiga toxin-producing Escherichia coli: a virulence function of inflammatory cytokine production from human monocytes. FEBS Lett. 2002;524(1-3):219-224. Available from: https://doi.org/10.1016/s0014-5793(02)03027-2
- Emamghorashi F, Farshad S, Kalani M. Relationship between O serotype and virulent genes in Escherichia coli causing urinary tract infections. Iran J Kidney Dis. 2011;5(4):234-237. Available from: https://sid.ir/paper/309065/en
- Johnson JR, Stell AL. Erratum: Extended virulence genotypes of Escherichia coli strains from patients with urosepsis in relation to phylogeny and host compromise. J Infect Dis. 2000;181(6):2122.
- Lima VN, Oliveira-Tintino CD, Santos ES, Morais LP, Tintino SR, Freitas TS, et al. Antimicrobial and enhancement of the antibiotic activity by phenolic compounds: Gallic acid, caffeic acid and pyrogallol. Microb Pathog. 2016;99:56-61. Available from: https://doi.org/10.1016/j.micpath.2016.08.004
- Abramson J, Adler J, Dunger J, Evans R, Green T, Pritzel A, et al. Accurate structure prediction of biomolecular interactions with AlphaFold 3. Nature. 2024;630:493–500. Available from: https://doi.org/10.1038/s41586-024-07487-w
- Lee GR, Won J, Heo L, Seok C. GalaxyRefine2: simultaneous refinement of inaccurate local regions and overall protein structure. Nucleic Acids Res. 2019;47(W1):W451–W455. Available from: https://doi.org/10.1093/nar/gkz288
- Schwede T, Kopp J, Guex N, Peitsch MC. SWISS-MODEL: an automated protein homology-modeling server. Nucleic Acids Res. 2003;31(13):3381–3385. Available from: https://doi.org/10.1093/nar/gkg520
- Tian W, Chen C, Lei X, Zhao J, Liang J. CASTp 3.0: computed atlas of surface topography of proteins. Nucleic Acids Res. 2018;46(W1):W363–W367. Available from: https://doi.org/10.1093/nar/gky473
- Liu Y, Yang X, Gan J, Chen S, Xiao ZX, Cao Y. CB-Dock2: improved protein–ligand blind docking by integrating cavity detection, docking and homologous template fitting. Nucleic Acids Res. 2022;50(W1):W159–W164. Available from: https://doi.org/10.1093/nar/gkac394
- Ponnusamy P, Natarajan V, Sevanan M. In vitro biofilm formation by uropathogenic Escherichia coli and their antimicrobial susceptibility pattern. Asian Pac J Trop Med. 2012;5(3):210–213. Available from: https://doi.org/10.1016/s1995-7645(12)60026-1
- Shah C, Baral R, Bartaula B, Shrestha LB. Virulence factors of uropathogenic Escherichia coli (UPEC) and correlation with antimicrobial resistance. BMC Microbiol. 2019;19:204. Available from: https://doi.org/10.1186/s12866-019-1587-3
- Zamani H, Salehzadeh A. Biofilm formation in uropathogenic Escherichia coli: association with adhesion factor genes. Turk J Med Sci. 2018;48(1):162–167. Available from: https://doi.org/10.3906/sag-1707-3
- Salman RS, Hussin SS. A multiplex PCR for detection of hlyA, papC, and traT genes in multidrug resistance Escherichia coli isolated from pregnant women. Al Mustansiriyah J Pharm Sci. 2013;13(2):129-138. Available from: https://doi.org/10.32947/ajps.v13i2.219
- Baby S, Karnaker VK, Geetha RK. Determination of phenotypic expression of the fimbriae and hemolysin of uropathogenic Escherichia coli (UPEC). Int J Adv Med. 2014;1(1):13-18. Available from: https://www.ijmedicine.com/index.php/ijam/article/view/435
- Jadhav S, Hussain A, Devi S, Kumar A, Parveen S, Gandham N, et al. Virulence characteristics and genetic affinities of multiple drug resistant uropathogenic Escherichia coli from a semi urban locality in India. PLoS One. 2011;6(3):e18063. Available from: https://doi.org/10.1371/journal.pone.0018063
- Kumar N, Bhat S, Bhat A, Saralaya V, Mulki SS. Characterization of virulence factors and antibiotic resistance pattern of uropathogenic Escherichia coli strains in a tertiary care center. F1000Res. 2022;11:1163. Available from: https://doi.org/10.12688/f1000research.125596.2
- Moeinizadeh H, Shaheli M. Frequency of hlyA, hlyB, hlyC and hlyD genes in uropathogenic Escherichia coli isolated from UTI patients in Shiraz. GMS Hyg Infect Control. 2021;16:Doc25. Available from: https://doi.org/10.3205/dgkh000396
- Al–Ubaidy A, Al-Ibadi M. Detection of urovirulence genes (eae, E-hly, α-hly) of uropathogenic Escherichia coli by specific PCR. J Biotechnol Res Cent. 2010;4(1):44–54. Available from: https://doi.org/10.24126/jobrc.2010.4.1.93
- Dadi BR, Abebe T, Zhang L, Mihret A, Abebe W, Amogne W. Distribution of virulence genes and phylogenetics of uropathogenic Escherichia coli among urinary tract infection patients in Addis Ababa, Ethiopia. BMC Infect Dis. 2020;20:108. Available from: https://doi.org/10.1186/s12879-020-4844-z
- Asadi S, Kargar M, Solhjoo K, Najafi A, Ghorbani-Dalini S. The association of virulence determinants of uropathogenic Escherichia coli with antibiotic resistance. Jundishapur J Microbiol. 2014;7(5):e9936. Available from: https://doi.org/10.5812/jjm.9936
- Derakhshan S, Ahmadi S, Ahmadi E, Nasseri S, Aghaei A. Characterization of Escherichia coli isolated from urinary tract infection and association between virulence expression and antimicrobial susceptibility. BMC Microbiol. 2022;22(1):89. Available from: https://doi.org/10.1186/s12866-022-02506-0
- Oliveira FA, Paludo KS, Arend LNVS, Farah SMSS, Pedrosa FO, Souza EM, et al. Virulence characteristics and antimicrobial susceptibility of uropathogenic Escherichia coli strains. Genet Mol Res. 2011;10(4):4114–4125. Available from: https://doi.org/10.4238/2011.october.31.5
- Chew YL, Goh JK, Arasi C. Investigation on antibacterial activity of pyrogallol in methicillin resistant Staphylococcus aureus. Curr Trends Biotechnol Pharm. 2020;14(5):176–180. Available from: http://dx.doi.org/10.5530/ctbp.2020.4s.20