
More Information
Submitted: 18 December 2019 | Approved: 30 December 2019 | Published: 31 December 2019
How to cite this article: Iles RK, Nicolaides K, Pais RJ, Zmuidinaite R, Keshavarz S, et al. The importance of gestational age in first trimester, maternal urine MALDI-Tof MS screening tests for Down Syndrome. Ann Proteom Bioinform. 2019; 3: 010-017.
DOI: 10.29328/journal.apb.1001008
Copyright License: © 2019 Iles RK, et al. This is an open access article distributed under the Creative Commons Attribution License, which permits unrestricted use, distribution, and reproduction in any medium, provided the original work is properly cited.
Keywords: Mass spectrometry; MALDI; Trisomy; Down syndrome; Prenatal screening; Aneuploidy
Abbreviations: AFP: Alpha-Fetoprotein; CHCA: Alpha-Cyano-4-Hydroxycinnamic Acid; CRL: Crown Rump Length; hCG: human Chorionic Gonadotropin; hCGbcf: human Chorionic Gonadotropin beta core fragment; LMP: Last Menstrual Period; m/z: mass to charge ratio; MALDI: Matrix Assisted Laser Desorption; MS: Mass Spectrometry; NIPT: Non-Invasive Prenatal Testing; PAPP-A: Pregnancy-Associated Plasma Protein A; PCR: Polymerase Chain Reaction; ROC: Receiver Operator Curve plots; RR: Relative Risk; T21: Trisomy 21; ToF: Time of Flight

The importance of gestational age in first trimester, maternal urine MALDI-Tof MS screening tests for Down Syndrome
Ray K Iles1*, Nicolaides K2, Pais RJ1, Zmuidinaite R1, Keshavarz S1, Poon LCY2 and Butler SA1
1MAP Sciences Ltd, Priory Business Park, Bedford I-lab Stannard Way, Bedford MK44 3RZ, London, UK
2Harris Birthright Centre, The Fetal Medicine Research Institute, King’s College Hospital, 16-20 Windsor Walk, 3rd Floor, London, UK
*Address for Correspondence: Ray K Iles, MAP Sciences Ltd, Priory Business Park, Bedford I-lab Stannard Way, Bedford MK44 3RZ, London, Tel: +44 7790 252710; Email: [email protected]
Background: The proposal that MALDI-ToF mass spectrometry could be used as a direct, rapid and affordable diagnostic tool in clinical laboratory medicine has moved from a theoretical possibility to a reality for Microbiology. Several studies have proposed the application of this technology in obstetric and gynaecological evaluation of patients. In particular, we have proposed that the adoption of MALDI-ToF mass spectrometry in examination of maternal pregnancy urine samples for the detection of Downs syndrome.
Methods: A retrospective collection of 20 Down Syndrome and 100 non-aneuploid pregnancy urines at 12 to 14 weeks gestation, collected in 2007-2008 from high risk pregnancy cohorts, were examined by MALDI-ToF mass spectrometry in the mass/charge range between 1000 and 100000 m/z. Normalisation of spectral data was defined using mass bins of 100 m/z expressed as a percentage of the total ion count of the mass spectra from 2000 to 11000 m/z. Of the ninety 100 m/z bins, forty-six were identified as m/z bins at which statistically significant differences in spectra occurred between Downs and control/non-aneuploid samples. Based on the differences and variance, for values at these bins, weighted scores of the probability of being Downs were assigned. Comparative algorithms consisting of various mass bins were tested for ability to distinguish Down syndrome from non-aneuploid pregnancy.
Results: Although various algorithms could distinguish Downs from non-aneuploid controls, it was found that gestational age was a confounding factor and that if separated into gestational age matched cohorts the ability to distinguish the groups improved dramatically e.g. whilst a 19 bins algorithm separated 100% of Downs from non-aneuploid pregnancies for a 9% false positive rate in the mixed gestational ages group; a two bin algorithm distinguished 100% of Downs for a 6% false positive rate for the 12 weeks gestational age pregnancies.
Conclusion: Normalised MALDI-ToF mass spectra, at 2000 to 11000 m/z, of maternal urine gives rise to gestational age specific screening tests algorithms for Downs’s syndrome.
The proposal that matrix assisted laser desorption ionization (MALDI) time of flight (ToF) mass spectrometry (MS) could be used as a direct, rapid and affordable diagnostic, tool in clinical laboratory medicine has moved from a theoretical possibility to a reality for Microbiology [1-3]. Significant benefits to both diagnostic efficacy and health economics, are only now being appreciated where significant saving are seen in costs per test and time to results [4,5]. Several studies have proposed the application of MALDI ToF MS technology in obstetric and gynaecological evaluation of patients [6-12]. In particular, we have proposed that the adoption of this technology in examination of maternal pregnancy urine samples for the detection of Downs syndrome. This will have equally dramatic benefits to prenatal screening costs and speed of clinical management [13].
The premise of our MALDI-ToF MS approach is not the measurement of a known single, or multiple biomarkers, but spectral profiling and pattern recognition as the basis of predicting a pregnancy outcome. In order to achieve comparative analysis, we have already shown that spectral normalization of defined mass bins as area under the curve is a promising approach [13]. In our previous study, we only examined the spectral pattern from 6000 to 14000 m/z, as that incorporated the spectral pattern of the major urinary metabolite of human chorionic gonadotropin (hCG) - beta core fragment hCG (hCGβcf). In this study we extended the lower mass spectral range to include protein and protein metabolites greater than 2,000 m/z and reduced the upper range to 11000 m/z. An optimized method for generating reproducible comparable data was established and comparing the performance of various simple algorithms we examined whether the optimized data collection method (and extending the mass profile range) improved performance.
Patients and sampling
Comprising singleton pregnancies, urine samples were collected from women who were attending for routine assessment of risk for chromosomal abnormalities by measurement of fetal nuchal translucency thickness and maternal serum-free β-human chorionic gonadotrophin and pregnancy-associated plasma protein A at 11 + 0 to 13 + 6 weeks of gestation. Written informed consent was obtained from the women agreeing to participate in the study. Women were excluded from the study when they were found to have urinary tract infection or contamination in their midstream urine samples. The maternal urine (20-30 ml) were collected between 2007 and 2008 and frozen at -80 oC. Twenty urine samples from these women were subsequently found to be carrying a Trisomy 21 (Downs Syndrome) fetus and a further 100 urine samples identified not to be carrying an aneuploid fetus [13].
Sample processing, preparation and mass spectral analysis
Samples were transported frozen by courier to MAP Sciences laboratory for analysis. All samples were completely thawed at room temperature and vortex mixed for 1minute to maximize any precipitate dissolution prior to analysis by MALDI-ToF MS. Although urine can vary tremendously in solute concentration, in our optimized operational format 1µl of neat urine sample was placed on top of a prepared MALDI-ToF sample plate of 1µl dried and crystalized sinapinic acid matrix. As described previously [12], before completely drying, a further 1µl of Sinapinic acid matrix was added to the urine spot and allowed to recrystallize.
Sample spots were examined in a raster pattern of 500 profiles fired on ten times. This effectively gives 5000 replicate spectra from which an average is generated in the Shimadzu Axima CFR plus MALDI ToF mass spectrometer. Sample ionization was by a pulsing (50 Hz) nitrogen laser (λmax = 337 nm) and mass analysis by time of flight, in a positive linear mode, over a 1.2 metre flight tube. Laser energy was set at 90 to 110 on the arbitrary laser energy diffuser filter scale. Mass spectrometer was externally calibrated using equine Cytochrome C (12362 Da) (ProteoMass, Sigma-Aldrich) for both singly and doubly charged ions.
Data extraction, processing and reduction
The mass range initially examined was 2000 to 100000 m/z, but subsequently limited to collecting data between 2000 and 50000 m/z, in order to reduce file size. The spectral data was exported as comma delimited ASCII files. These files were processed systematically using a python script (version 2.7) developed in our lab. Using this script, the data on each file was summed into bins of 100 m/z intervals from 2000 m/z to 11000 m/z (total of 90 bins). The data was systematically normalized to be expressed as a percentage of the total spectra ion count between 2000 m/z to 11000 m/z. This normalisation rendered all spectra comparable in terms of peak intensity. The data was exported as a matrix in a comma separated values (csv) extension file containing all ninety 100m/z bin values of all samples under analysis. Files containing samples clustered by gestational age (Table 1) and clinical outcome were produced for comparative and statistical analysis.
| Table 1: Characteristics of samples in study | ||
| Weeks of Gestation | Control/non-aneuploid maternal urine samples | Downs pregnancy maternal urine samples |
| 12 weeks | 31 | 5 |
| 13 weeks | 37 | 13 |
| 14 weeks | 14 | 0 |
Sample rejection
Given the importance of comparability in both identified mass in the samples and peak intensities, samples that were extremely dilute and generated poorly resolved spectra, were rejected. A threshold of acceptable spectra was defined by the signal to noise ratio of a key component protein, hCGβcf. Based on a measured spectral ion count, samples in which the total spectral ion count ratio of the bin 9700-9800 m/z (central for the hCGβcf peak)/bin 10900 – 11000 m/z was below five were rejected. Samples rejected, typically, had poorly distinguishable peaks when plotted and on visual examination of the urine sample itself had very low colour intensity (data not shown). Visual examinations were conducted using the software m Mass version 5.5.0.
Data plotting and statistical analysis
Boxplots containing the variation and distribution of the data, as well as plots of median and arithmetic mean spectra were generated using R statistical package under Rstudio® integrative console environment. Statistical significance between each pair of bins in the spectra were computed using the two-sided Mann-Whitney U test with a confidence interval of 95%. The Mann-Whitney U tests were performed iteratively in R for each pair of bins and a plot with the resulting p-values was computed. All R code was produced in our lab under the version 3.5. The receiver operator curve plots (ROC) and the estimation of the optimal cut-offs for the algorithms were obtained using software written in our lab in python under the version 2.7. In this software, we implemented an iterative search for the optimal cut-offs based on the maximization of the difference between high sensitivity and false positive rate.
Algorithm generation
Samples were classified by gestational age, rounded to the nearest week of gestation, and grouped into Downs/trisomy 21 (T21) versus non-aneuploid high risk pregnancies (Table 1). Normalised spectra were computed and plotted as both arithmetic means and medians of these groups and gestational classes (Figures 1D, 2A-D and S2). Although clear median and average differences in intensity could be seen between the Downs and non-Downs sample, the intensity values at each m/z bin had large variances (Figures 1A,B and S1). Furthermore, each bin was assumed as an independent variable. Although, correlation between elevation of a particular bin and reduction of another was observed, these were not consistent/dependent events. Thus, each bin was examined independently for average differences with statistical significance (alpha < 0.05) between Downs/T21 and control/non-aneuploid groups, considering the respective distributions (Figures 1,2). Data from m/z bins, identified as significant, were plotted as normalized magnitude values against the ranked 10th centiles (i.e. 10th, 20th, 30th, 40th, 50th, 60th, 70th, 80th and 90th), comparing the Downs and non-aneuploid/control groups (data not shown). In the design of each algorithm a set of bins was selected to account for a gestational age interval. Each algorithm, intensity cut-offs were estimated based on comparing centile distributions of Downs/T21 versus control/non-aneuploid groups and identifying the thresholds that have the lowest population cross. The probability/relative risk (RR) of being a Downs pregnancy were then calculated by the fraction between the frequency of Downs and controls on these thresholds (see supplementary excel file S3 for the intensity cut-off values of each algorithm). For generating predictions using algorithms, the RR of the various combinations of m/z bins in which significant differences had been demonstrated, were summed according to the following equation:
Generic Algorithm Score =
The majority of relevant maternal urine proteins are seen between 2000 and 11000 m/z (Figure 1D). Mass signals corresponding to the glycoprotein hormone α-subunit (14000-17000 m/z), hCGβ-subunit (25000-27000 m/z) and hCG (35000-40000 m/z) [12,15], could be seen in some, but not all samples (< 75%). The metabolic product of hCGβ, β-core hCG (and associated glyco-variants), with a broad peak centring around 9,700 m/z, was seen in all samples [16].
Of the 120 samples supplied 20 were rejected (1 Downs and 19 control) because they proved to be very dilute and also based on our rejection criteria (see methods). Cropped baseline corrected spectra were computationally processed (see methods) resulting in a set of data with ninety bins of 100m/z, transformed to compare quantitatively the measurements as normalized area under the curve (2000 to 11000 m/z). Overall, the case to control ratio was 1:4, rounded to the nearest week, the majority (50%) of samples analyzed were of 13 weeks’ gestation and the maternal Downs urine samples were either 12 or 13 weeks of gestation (case to control ratios of 1:6 and 1:3 respectively) (Table 1).
Our results show intensity variation within 1-2 orders of magnitude for Downs/T21 and control/non-aneuploid pregnancy indicating high diversity within each population (Figures 1A,B and 2). Therefore, median spectra were compared for Downs/T21 versus control/non-aneuploid pregnancy (Figures 1D and 2C,D). Our results show several mass bins (highlighted in Figure 1D) with statistically significant differences between Downs/T21 in comparison with controls. Similar results were also obtained when averages were compared (data not shown).
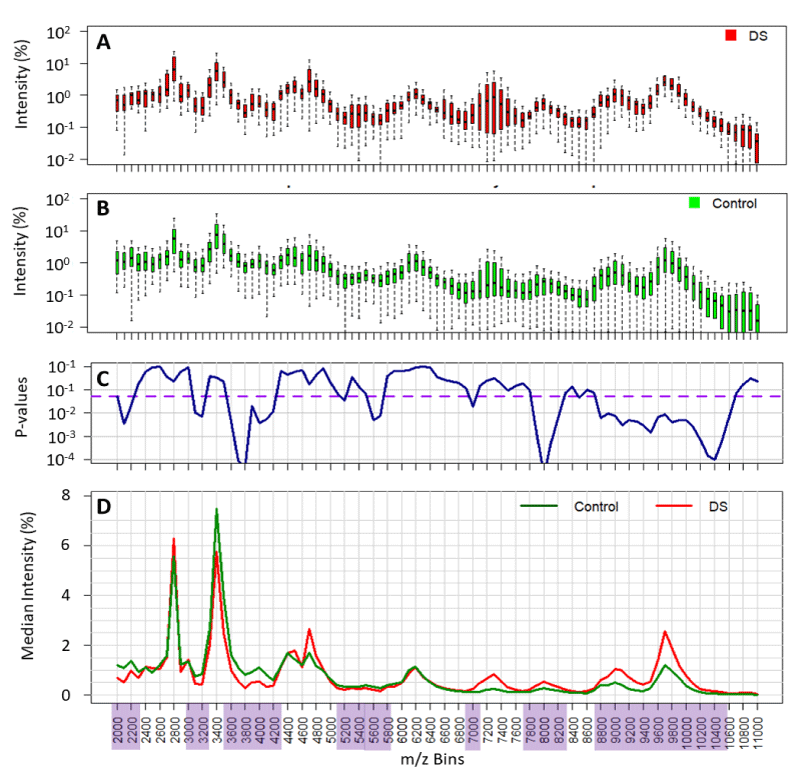
Figure 1: Comparison of the variability of normalised spectral value at each mass bin and its statistical difference between all Downs/T21 (DS) and non-aneuploid pregnancy urine spectra (control). Variability of data is shown in the boxplots (panel A and B). p - values of statistical differences shown in panel C. Threshold of significance (p - values < 0.05) are depicted in the purple dashed line and the significant mass bins highlighted in purple. Comparison of population medians highlighted in panel D.
Effect of gestational age on spectral profiles
The overall changes in profile with gestational age, amongst the non-aneuploid control samples, were analyzed and illustrated by plotting medians of 12, 13 and 14 weeks (Figure 2B). Similar results were also obtained when comparing the average profiles of Downs versus controls (Figure S2). However, the effects were more pronounced by the medians since data is skewed. Seven mass regions were identified that changed across gestational age. Strikingly, the differences between medians of Downs’s profiles at 12 and 13 weeks gestation show reverse changes across gestational age, particularly in the mass bins 2800 m/z and 3400 m/z (Figure 2A,B). These results indicate that gestational age is a confounding variable and should be taken into account for the design of predictive algorithms. The comparison of Downs/T21 with controls/non-aneuploid median spectra for the respective 12 and 13-week gestation samples was illustrated in Figure 2C,D, respectively. Here, we could pinpoint several differences in spectral medians, whereas 9 mass bins are highlighted for week 12 and 7 for week 13. Nevertheless, due to internal variation in regions not all have the same degree of significance as it was shown in the Mann-Whitney U Test p - values (Figure 2E,F). Thus, these results show that only particular regions of mass bins have statistically discriminatory power, therefore were used to develop predictive algorithms.
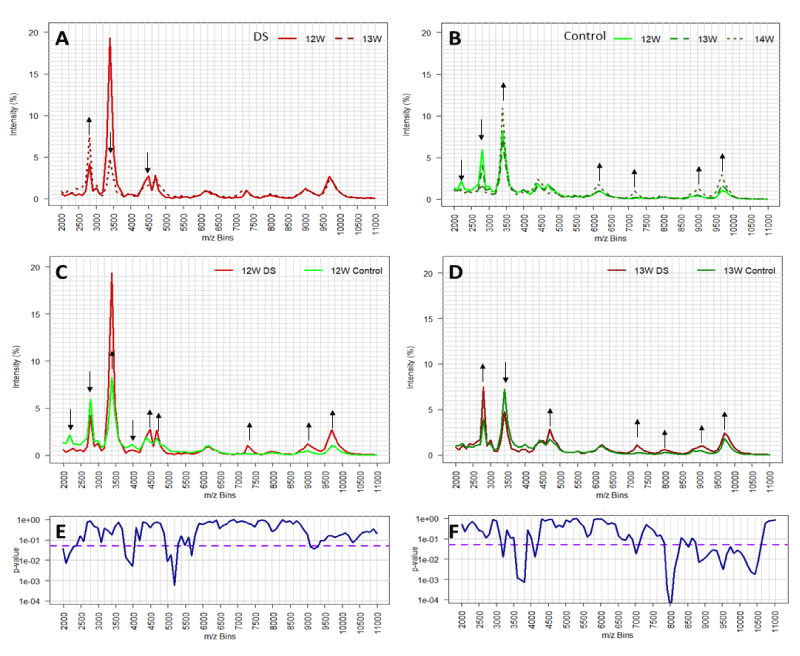
Figure 2: The effect of gestational age on mass spectral profiles of Downs maternal urine (DS, panel A) and non-aneuploid pregnancy urines (control, panel B). Comparison of urine mass spectral profiles (medians) between DS and control from pregnant with 12 and 13 weeks of gestation, panel C and D respectively. Mass bins with substantial changes in intensity are depicted through black arrows showing increase (up arrow) or decrease (down arrow). Statistical significance (p - values) of mass bins differences between DS and control population for 12 and 13 weeks of gestation are indicated in panels E and F, respectively. Threshold of significance (p - values < 0.05) are depicted in the purple dashed line.
Development of a probability weight cased algorithms
Based on identified bins that showed significant differences, various models are possible. These models could include all spectral measurements or only selective m/z bins that complement in the identification of Downs pregnancy. A total of forty of the 90 m/z bins demonstrated statistically significant differences (p < 0.05). Of these: nine where between p > 0.009 and p < 0.05; and thirty-one with p < 0.009 (Figure 1C). For the data of gestational ages of 12 and 13 weeks less m/z bins demonstrated statistically significant differences (sixteen and twenty-nine respectively, Figure 2E-F). Taken these results into account, we have selected four sets of significant bins for the development of predictive algorithms for Downs/T21 pregnancy. With these sets, a total of six predictive algorithms for Downs/T21 pregnancy were developed (Figure 3A). Two were developed for combined gestational age (19 bins and 7 bins algorithms), two specific for gestational age of 12 weeks (7 bins 12W and 2 bins 12W) and two specific for gestational age of 13 weeks (9 bins 13W and 7 bins 13W).
The developed algorithms-based m/z bin regions were evaluated through receiver operator curves and their performance was compared (Figure 3B,C). In general, all algorithms performed well with Wilcoxon estimate of area under the curve higher than 85% (data not shown). These results indicate that the 100 m/z bins algorithms designed for a particular gestational age (12 and 13 weeks) or considering combined gestational ages (11 to 14 weeks) have reasonable predictive capacity. The algorithms have shown differences in their optimal performance with sensitivities ranging from 84.2% - 100% and false positive rates ranging from 5.6% - 15.7% (Figure 3E). These results indicate that 7 and 2 bin algorithms specifically designed for week 12 of gestation had the best performance in predicting Down/T21 outcomes, with a pickup rate (sensitivity) of 100% and false positive rates of 5.6% and 8.3%. Moreover, the effect of gestational age on algorithm performance is illustrated by comparing the performances of the variants of 7 bins algorithms. These performances have shown that designing algorithms with a particular gestational age can boost the sensitivity of algorithms as well as can reduce false positive rate. On the other hand, the 19 bins algorithm designed with 11-14 weeks data had equally good pickup rate (sensitivity of 100%) but with a slightly higher false positive rate of 9%. Apparently, the increase in the number of m/z bins used in algorithms results in an increase of the algorithm sensitivity. However, this adds a cost of increasing false positives. This was shown by comparing the optimal performance of 7 and 19 bins algorithms. Taken together, these results indicate that both designing algorithms for a particular gestational age or including multiple mass bins are able to boost the performance of algorithms.
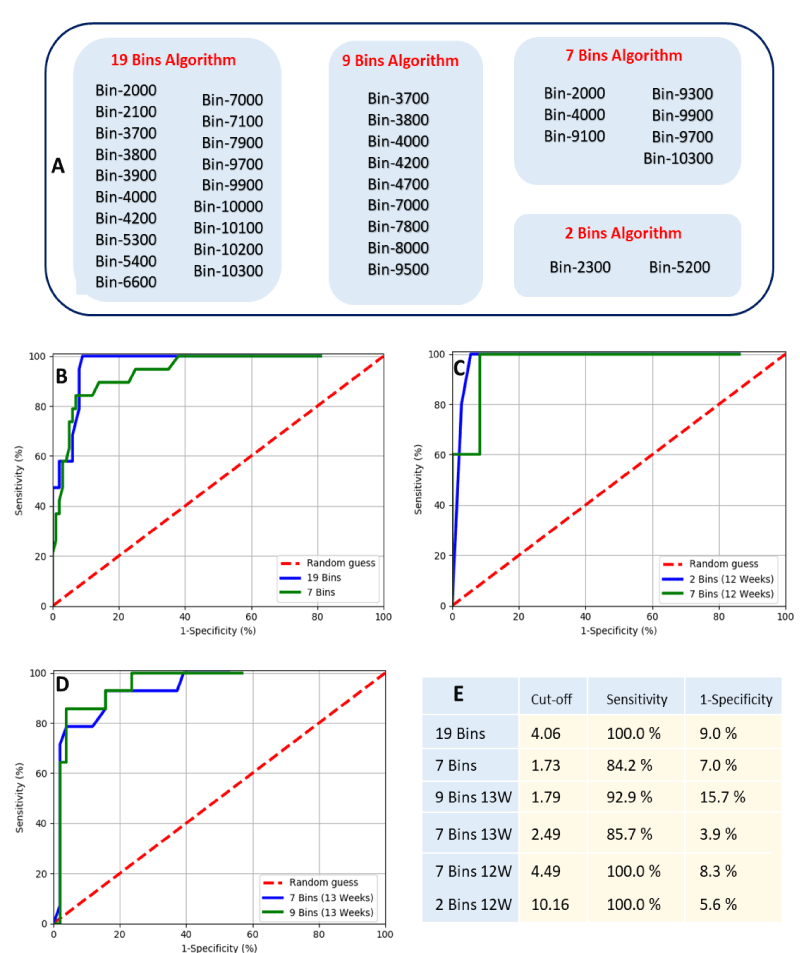
Figure 3: Mass bins that compose the 19 bins, 9 bins, 7 bins and 2 Bins algorithms for predicting Downs/T21 pregnancy based on MALDI-ToF mass spectral measurement (Panel A). Estimated optimal cut-offs for all algorithms and its computed sensitivity and false positive rate (1-specificity). ROC plot of predictive algorithms for Downs/T21 pregnancy considering all data with gestational age ranging from 11 to 14 weeks (Panel B). ROC plots of predictive algorithms only considering data with a particular gestational age, either 12 weeks or 13 weeks of gestation (Panel C and D, respectivelly).
Standardisation of analysis and normalisation
The generation of MALDI spectra from urine (using Sinapinic acid as matrix) is very different to that generated by clinical microbiology biotyping. In particular laser energy exposure to the sample matrix is typically 3 to 4 times that used (when alpha-Cyano-4-hydroxycinnamic acid (CHCA) matrix is typically employed) to generate characteristic ribosomal proteins in bacterial culture identification by MALDI-ToF MS. In addition, the generation of MALDI-ToF mass spectra for semi-quantitative rather than qualitative peak comparison, requires the collection of thousands of repeat spectra in order to accumulate an “averaged” spectral profile which closely approximates to the true average as possible. A raster profiling of 500 spots across the sample, with 10 shots at each spot, gave us reproducible profiles with low background variability within 7 mins. The confidence in the generated spectra’s approximation to the true sample average can increases with the number of profiles collected. However, there is then a trade-off between reproducibility and time taken to analyze each sample. Nevertheless, with an introduction of the new, bench top mass spectrometers such as MALDI-8020 (Shimadzu), sample acquisition time is reduced to below a minute, therefore eliminating the trade-off.
MALDI-ToF MS instrument displays peaks and data as a percentage relative to the highest peak within the display field. This is because the difference of peak intensity over any range, but particularly wide ranges, of masses can be several orders of log10. Thus, scaling is always a problem when displaying mass spectral data. Narrowing down a range and displaying data as an intensity relative to the highest peak in the displayed region is a sensible solution which is universal to mass spectrometry analysis software. Furthermore, the original principle function of the MALDI-ToF MS has otherwise been to identify mass peaks, so only signal intensity relative to a base line of noise was truly relevant. However, when comparing data in a moderate or broad range of masses, in which a dominant peak in one sample becomes a secondary peak to another, renders the Y axis % intensity values non-comparable. Normalization in order to render the Y axis intensity a comparable was achieved by exporting the raw averaged ASCII data of calibrated m/z values (x-axis) versus the actual measured mV generated at each m/z channel (y-axis) for mathematical manipulation, and not the display data. Taking the entire spectral intensity from 2000 to 11000 m/z represented a significant proportion of the total proteins excreted by the kidney [17]. In fact, as the kidneys usually only allow proteins of less than 10000 daltons to pass [18,19], this represents the important ‘normal fraction’ of excreted protein. By normalizing against the total spectral intensity of 2000 to 11000 m/z we effectively corrected the spectral analysis against total “normal protein fraction” in each urine sample. This is a more reliable urinary total protein assays than other methods, such as Biuret or UV (280 nm) absorption, which will react/record all amino acids, peptides and proteins; including those greater than 10 kD. Thus, this total excreted metabolites normalisation approach, ignores peptides and free amino-acids less than 2 kD which, vary with diet and eating times; and high molecular mass proteins, which may be due to kidney pathologies. Thus, correcting against total signal from 2000 to 11000 m/z, not only rendered all sample spectra comparable in terms of intensity but also allowed for a nullification of the dilution effects of variable water output of a patient; and other unrelated confounding variables associated with the analysis of urine.
Statistical data analysis and spectral comparison
The normalization of the mass spectra and allocation into 90 x 100 m/z bins, not only allowed spectra-to-spectra comparisons on intensity but established the number of total variables being analyzed i.e. each spectral bin represents a mass region of 100 m/z in which the variability of a molecular species found within the sample may be measured. Furthermore, these were sometimes seen as distinct peaks, each of which can be regarded as an independent variable. In addition, as we have previously demonstrated, even small variations in mass detected by a MALDI-ToF MS reflect a change due to a physical mass molecular modification, such as amino acid cleavage/substitution or glyco-variation [16,19,20]. Thus, a related molecule in a peak spanning several 100 m/z can be delineated as modification/cleavage variants detected at 100 m/z units and thus treated as an independent variable in mathematical analysis of the data (even though they may in fact be semi-independent variables). This is critical as even slight modification in molecular structure can be indicative of a disorder but be a feature not recognized by an immunoassay [16].
For the vast majority of the data sets the distribution of data was skewed, so significance was established by non-parametric, ranked data statistical analysis using Mann-Whitney U Test. As sample numbers are small, the probability value from the Mann-Whitney U test also reflected the degree of separation of the Downs population from that of the non-aneuploidy control population. Thus, an m/z bin in which the Mann-Whitney U test with p-value lower than 0.009 was likely to have less population cross over with the Control/ non-aneuploid group in comparison with tests with a p-value of 0.05. This assumption is a surrogate mathematical marker and does not work when very large number data sample sets are compared (when the n value predominates in the statistic even the smallest differences in distribution will be highly significant). A problem for metabolomics and proteomics is that the resolution of mass spectrometry is so powerful that the volume and detail, of information generated is so great that you can end up not seeing the wood for the trees. Indeed, it has been said of this analogy that in fact we are comparing the leaves on the tree. This problem is avoided by the approach described here which is akin to bringing into vision the correct resolution to see the wood. If the mass bins or window are too large you lose the ability to distinguish the chemico-physical mass variant. Although smaller m/z bin/window sizes can be used in a first pass analysis, the confidence that adjacent bins can be treated as independent variables in further statistical analysis may decrease. Furthermore, finer resolution analysis can be sensibly employed once the appropriate regions of significant difference have been identified, as we have described.
Gestational age correction
The urinary molecular species between 2000 and 11000 m/z, that are altered in pregnancy conditions such as Downs syndrome, are likely to derive, predominately, as metabolites of pregnancy associated serum protein hormones and fetal protein molecules, seen in maternal blood; such as hCG, pregnancy-associated plasma protein A (PAPP-A), Inhibin A, alpha-fetoprotein (AFP) etc. [21-23]. All of which vary in circulating concentration independently and dramatically with gestation [24]. Thus, the levels found in urine will be influenced by maternal blood levels and the different metabolic rates of the molecules will be reflected in our analysis. This has not been fully appreciated when urinary marker tests for Downs Syndrome screen have been evaluated previously [25]. The m/z bin centile distribution plots make no assumption as to the normality of distribution of the data; which for each group, and at each m/z, could be Gaussian but are frequently skewed. Although the distributions can be modelled by beta and gamma probability distributions, this complexity is circumvented here by simple centile plots of cases versus controls and reading of relative risk cut off from the plots. As more data is accrued the distribution plots become more accurate and the modelled distribution also.
As discussed above, the various molecules that make up the spectral patterns, change in total amount and relative concentration with gestational age, and hence significance cut-off values will alter with gestational age. Since gestational age is easily measured, by last menstrual period (LMP) or ultrasound dating of crown rump length (CRL), this major cause of further variability can be corrected for [26]. The most widely accepted method is to express data corrected to gestational age determined by early pregnancy ultrasound scan, but this may not be common place in third world countries and an LMP based algorithm would be more appropriate. Significantly, LMP and ultrasound-based dating can vary by up to two weeks. The importance of gestational age matching to the correct algorithm is exemplified by the peaks at 2300 to 2700m/z and 3100 to 3400 m/z seen in all profiles (Figure 2A-D).
Although these mass bins showed graphically large differences between Downs and non-Downs; these regions were not employed in any initial algorithms because of the unusual distributions found. What became clear is that at 12 weeks’ gestation the levels of the prominent peaks at ~2300 m/z were lower in the Downs pregnancies but elevated at 13 weeks’ gestation, compared to age matched controls. Whilst the prominent peaks at ~ 3400 m/z, for Downs samples at 12 weeks’ gestation, were significantly elevated compared to that of non-aneuploid/control samples, but generally lower than non-aneuploid controls at 13 weeks’ gestation (Figure 2C,D). This example of pattern changes reinforces the independence of the profile components of m/z bins and that, not only will the responsible molecules levels change with gestational age but that, these changes are independent of each other. Thus, one m/z bin or mass spectra peak, may be significant as a marker of Downs at an early gestational age but not a later gestation and vice-versa. Changes in profiles and quantitative values with gestational age was noted in our original study [13], but this was not as dramatic as seen here for the lower spectral masses now included in our analysis.
Urinary screening by MALDI ToF MS in view of current practices
This gestational age and mathematical correction required in our MALDI ToF MS urinary spectra profiling tests is akin to the multiple of median correction adopted in conventional maternal serum and proposed metabolomics screening tests for Down syndrome [27-32]. Thus, an optimized screening test for Down syndrome pregnancy by maternal urinary MALDI ToF MS analysis will require dating of the pregnancy at sampling so that an appropriate decision algorithm can be applied. A urinary test simplifies samples collection and we have already described the MALDI-Tof MS profile test as cost effective, non-invasive and rapid, in comparison to prenatal screening using maternal serum biomarkers combined with ultrasound anatomical markers. In particular the accuracy of ultrasound testing is highly dependent on experts performing the screening, and the advantages over current practices are therefore very clear. Furthermore, the relatively new free fetal DNA, non-invasive prenatal testing (NIPT), besides its high costs, has been shown to be prone to several failures such as low fetal fraction in maternal serum free DNA, inadequate number of reads, poor polymerase chain reaction (PCR) conditions or contamination that arise due to complex methodology [33]. However, rather than replace the highly accurate NIPT test MALDI-ToF MS pregnancy urine screening provides a much more affordable front line mass screening tool and NIPT should be reserved for very high risk and potentially screen positive pregnancies only. An affordable mass population pregnancy urinary prenatal testing system, as described here, has clear advantages for countries where access to ultrasound and NIPT is restricted because of cost or geography.
In this work, we have provided a comparison of averaged profiles from gestational age matched samples from control/non-aneuploid and Downs samples showing quantitative differences in urinary mass spectral profiles as gestational age progressed. Significantly, there is also qualitative/quantitative profile difference in Downs’s samples when compared to normal/control samples. These qualitative and quantitative changes have led us to conclude that week of gestation is a confounding variable that should be accounted for the design of predictive algorithms. In addition, we have shown here that refining the algorithm to the nearest week of gestation improved the specificity, while not affecting the sensitivity. We have also demonstrated that maternal urine MALDI-ToF MS based algorithms have the potential to be rapid, robust and non-invasive diagnostic methods for the identification of the Downs syndrome pregnancies. Furthermore, the potential cost benefit advantage is substantial, especially when used as a mass screening tool in populations with restrictive access to ultrasound and NIPT.
Ethics approval and consent to participate
This study was approved by King’s College Hospital Ethics Committee (02‐03‐033). And by the internal Ethics committee of MAP Sciences, receiving anonymized samples for analysis. Written informed consent was obtained from the women agreeing to participate in the study. Written informed consent was obtained from women agreeing to participate in the study.
Availability of data and material
The datasets generated and/or analyzed during the current study are not publicly available due privacy policy of MAP Sciences, but are available from the corresponding author on reasonable request.
Competing interests
Iles RK and Butler SA have filed patents on MALDI ToF mass spectral profiling. Iles RK and Butler SA declare a potential conflict of interest through part ownership of shares in MAP Sciences Ltd. Nicolaides K and Poon LCY declares that there is no conflict of interest that could be perceived as prejudicing the impartiality of the research reported. Zmuidinaite R and Keshavarz S are employees of MAP Sciences Ltd.
Funding
Mass spectral Analysis was funded by MAP Sciences Ltd.
Authors’ contributions
Iles RK, Nicolaides K, Poon LCY and Butler SA designed the experiments. Iles RK drafted the manuscript. Zmuidinaite R and Keshavarz S carried out sample collection, prepared the clinical sample and conducted the mass spectral analysis. Iles RK, Pais RJ and Zmuidinaite R analyzed the MS data and developed the diagnostic algorithms.
Sample collection and patient sample management (Anonymisation and meta-data collection and validation) was supported by a grant from the Fetal Medicine Foundation (Charity No: 1037116).
- Seng P, Drancourt M, Gouriet F, La Scola B, Fournier PE, et al. Ongoing Revolution in Bacteriology: Routine Identification of Bacteria by Matrix-Assisted Laser Desorption Ionization Time-of-Flight Mass Spectrometry. Clin Infect Dis. 2009; 49: 543-551. PubMed: https://www.ncbi.nlm.nih.gov/pubmed/19583519
- Fall B, Lo CI, Samb-Ba B, Perrot N, Diawara S, et al. The ongoing revolution of MALDI-TOF mass spectrometry for microbiology reaches tropical Africa. Am J Trop Med Hyg. 2015; 92: 641-647. PubMed: https://www.ncbi.nlm.nih.gov/pubmed/25601995
- Nomura F. Proteome-based bacterial identification using matrix-assisted laser desorption ionization-time of flight mass spectrometry (MALDI-TOF MS): Arevolutionary shift in clinical diagnostic microbiology. Biochim Biophys Acta. 2015; 1854: 528-537. PubMed: https://www.ncbi.nlm.nih.gov/pubmed/25448014
- Gaillot O, Blondiaux N, Loïez C, Wallet F, Lemaître N, et al. Cost-effectiveness of switch to matrix-assisted laser desorption ionization-time of flight mass spectrometry for routine bacterial identification. J Clin Microbiol. 2011; 49: 4412. PubMed: https://www.ncbi.nlm.nih.gov/pubmed/21998417
- Tan KE, Ellis BC, Lee R, Stamper PD, Zhang SX, et al. Prospective evaluation of a matrix-assisted laser desorption ionization-time of flight mass spectrometry system in a hospital clinical microbiology laboratory for identification of bacteria and yeasts: a bench-by-bench study for assessing the impact on time to identification and cost-effectiveness. J Clin Microbiol. 2012; 50: 3301-3308. PubMed: https://www.ncbi.nlm.nih.gov/pubmed/22855510
- Lee SM, Park JS, Norwitz ER, Kim SM, Kim BJ, et al. Characterization of discriminatory urinary proteomic biomarkers for severe preeclampsia using SELDI-TOF mass spectrometry. J Perinat Med. 2011; 39: 391-396. PubMed: https://www.ncbi.nlm.nih.gov/pubmed/21557676
- Shin JK, Baek JC, Kang MY, Park JK, Lee SA, et al. Proteomic analysis reveals an elevated expression of heat shock protein 27 in pre-eclamptic placentas. Gynecol Obstet Invest. 2011; 71: 151-157.
- Narasimhan K, Lin SL, Tong T, Baig S, Ho S, et al. Maternal serum protein profile and immune response protein subunits as markers for non-invasive prenatal diagnosis of trisomy 21, 18, and 13. Prenat Diagn. 2013; 33: 223-231. PubMed: https://www.ncbi.nlm.nih.gov/pubmed/23371439
- Siciliano RA, Mazzeo MF, Spada V, Facchiano A, d'Acierno A, et al. Rapid peptidomic profiling of peritoneal fluid by MALDI-TOF mass spectrometry for the identification of biomarkers of endometriosis. Gynecol Endocrinol. 2014; 30: 872-876. PubMed: https://www.ncbi.nlm.nih.gov/pubmed/25111755
- Wang L, Liu HY, Shi HH, Lang JH, Sun W. Urine peptide patterns for non-invasive diagnosis of endometriosis: a preliminary prospective study. Eur J Obstet Gynecol Reprod Biol. 2014; 177: 23-28. PubMed: https://www.ncbi.nlm.nih.gov/pubmed/24694773
- Wölter M, Röwer C, Koy C, Rath W, Pecks U, et al. Proteoform profiling of peripheral blood serum proteins from pregnant women provides a molecular IUGR signature. J Proteomics. 2016; 3919: 30148-30158. PubMed: https://www.ncbi.nlm.nih.gov/pubmed/27109350
- Butler SA, Luttoo J, Abban TK, Musthan ZB, Borrelli PTA, et al. Truncated Human Chorionic Gonadotropin Variant in Hyperemesis Gravidarum: Possible Links to Hyperthyroidism and Emesis as a Thyroid Stimulating Hormone Analogue. 2018.
- Iles RK, Shahpari ME, Cuckle H, Butler SA. Direct and rapid mass spectral fingerprinting of maternal urine for the detection of Down syndrome pregnancy. Clin Proteomics. 2015; 12: 9. PubMed: https://www.ncbi.nlm.nih.gov/pubmed/25878568
- Poon LC, Kametas N, Bonino S, Vercellotti E, Nicolaides KH. Urine albumin concentration and albumin-to-creatinine ratio at 11(+0) to 13(+6) weeks in the prediction of pre-eclampsia. BJOG. 2008; 115: 866-873. PubMed: https://www.ncbi.nlm.nih.gov/pubmed/18485165
- Butler SA, Luttoo J, Freire MO, Abban TK, Borrelli PT, et al. Human chorionic gonadotropin (hCG) in the secretome of cultured embryos: hyperglycosylated hCG and hCG-free beta subunit are potential markers for infertility management and treatment. Reprod Sci. 2013; 20: 1038-1045. PubMed: https://www.ncbi.nlm.nih.gov/pubmed/23439616
- Iles RK, Cole LA, Butler SA. Direct analysis of hCGβcf glycosylation in normaland aberrant pregnancy by matrix-assisted laser desorption/ionizationtime-of-flight mass spectrometry. Int J Mol Sci. 2014; 15: 10067-10082.
- Lillehoj EP, Poulik MD. Normal and abnormal aspects of proteinuria. Part I: Mechanisms, characteristics and analyses of urinary protein. Part II: Clinical considerations. Exp Pathol. 1986; 29: 1-28. PubMed: https://www.ncbi.nlm.nih.gov/pubmed/2422051
- Mutti A, Alinovi R, Ghiggeri GM, Bergamaschi E, Candiano G, et al. Urinary excretion of brush-border antigen and plasma proteins in early stages of diabetic nephropathy. Clin Chim Acta. 1990; 188: 93-100. PubMed: https://www.ncbi.nlm.nih.gov/pubmed/2379316
- Fomina EV, Lisova NIu, Kireev KS, Tiys ES, Kononikhin AS, et al. Kidney function and urine protein composition in healthy volunteers during space station fitness tests. Aerosp Med Hum Perform. 2015; 86: 472-476. PubMed: https://www.ncbi.nlm.nih.gov/pubmed/25945665
- Jacoby ES, Kicman AT, Laidler P, Iles RK. Determination of the glycoforms ofhuman chorionic gonadotropin beta-core fragment by matrix-assisted laserdesorption/ionization time-of-flight mass spectrometry. Clin Chem. 2000; 46: 1796-1803. PubMed: https://www.ncbi.nlm.nih.gov/pubmed/11067815
- Mariona FG, Hassan MM, Syner FN, Chik LC, Sokol RJ. Maternal serum alpha-fetoprotein (MSAFP) and fetal growth. J Perinat Med. 1984; 12: 179-183. PubMed: https://www.ncbi.nlm.nih.gov/pubmed/6210354
- Westergaard JG, Teisner B, Grudzinskas JG, Chard T. Single measurements ofchorionic gonadotropin and schwangerschafts protein for assessing gestational ageand predicting the day of delivery. J Reprod Med. 1985; 30: 57-60. PubMed: https://www.ncbi.nlm.nih.gov/pubmed/3871857
- Pedersen JF, Sørensen S, Ruge S. Human placental lactogen and pregnancy-associated plasma protein A in first trimester and subsequent fetal growth. Acta Obstet Gynecol Scand. 1995; 74: 505-508. PubMed: https://www.ncbi.nlm.nih.gov/pubmed/7542426
- Alldred SK, Takwoingi Y, Guo B, Pennant M, Deeks JJ, et al. First trimester serum tests for Down's syndrome screening. Cochrane Database Syst Rev. 2015; 11: CD011975. PubMed: https://www.ncbi.nlm.nih.gov/pubmed/26617074
- Alldred SK, Guo B, Takwoingi Y, Pennant M, Wisniewski S, et al. Urine tests for Down's syndrome screening. Cochrane Database Syst Rev. 2015; 12: CD011984. PubMed: https://www.ncbi.nlm.nih.gov/pubmed/26662198
- Roberts CJ, Hibbard BM, Evans DR, Evans KT, Laurence KM, et al. Precision in estimating gestational age and its influence on sensitivity of alphafetoprotein screening. Br Med J. 1979; 1: 981-983. PubMed: https://www.ncbi.nlm.nih.gov/pubmed/86376
- Hadlock FP, Deter RL, Harrist RB, Park SK. Estimating fetal age: computer-assisted analysis of multiple fetal growth parameters. Radiology. 1984; 152: 497-501. https://www.ncbi.nlm.nih.gov/pubmed/6739822
- Morin JF, Moineau MP, Richard-Girème A, Talon H. Development of medians generators for the calculation of MoM for the first-trimester Down syndrome maternal serum markers. Ann Biol Clin. 2016; 74: 293-298. PubMed: https://www.ncbi.nlm.nih.gov/pubmed/27237803
- Trivedi DK, Iles RK. HILIC-MS-based shotgun metabolomic profiling of maternal urine at 9-23 weeks of gestation - establishing the baseline changes in the maternal metabolome. Biomed Chromatogr. 2015; 29: 240-245. PubMed: https://www.ncbi.nlm.nih.gov/pubmed/24898723
- Trivedi DK, Iles RK. Do not just do it, do it right: urinary metabolomics - establishing clinically relevant baselines. Biomed Chromatogr. 2014; 28: 1491-1501. PubMed: https://www.ncbi.nlm.nih.gov/pubmed/24788800
- Trivedi DK, Iles RK. Shotgun metabolomic profiles in maternal urine identify potential mass spectral markers of abnormal fetal biochemistry - dihydrouracil and progesterone in the metabolism of Down syndrome. Biomed Chromatogr. 2015; 29: 1173-1183. PubMed: https://www.ncbi.nlm.nih.gov/pubmed/25545476
- RK Iles, SA Butler. Prenatal Screening - US Patent App. 2016.
- Palomaki GE, Kloza EM. Prenatal cell-free DNA screening test failures: a systematic review of failure rates, risks of Down syndrome, and impact of repeat testing. Genetics in Medicine. 2018.